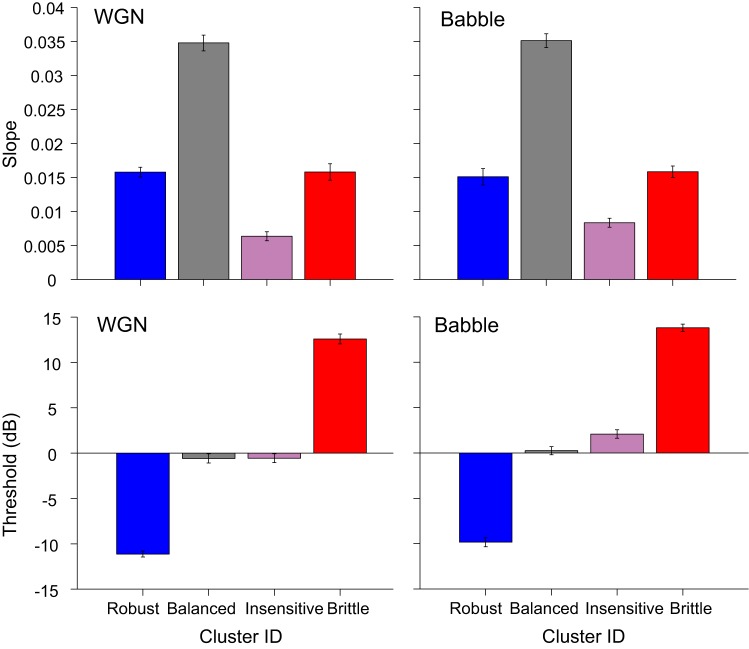
Fig. 7.
EI profile slope and threshold for different response groups under WGN and Babble conditions. EI profile slope and threshold were averaged across vocalizations within response groups (means ± SE). Color denotations of the bar plots are the same as in Fig. 6A.

