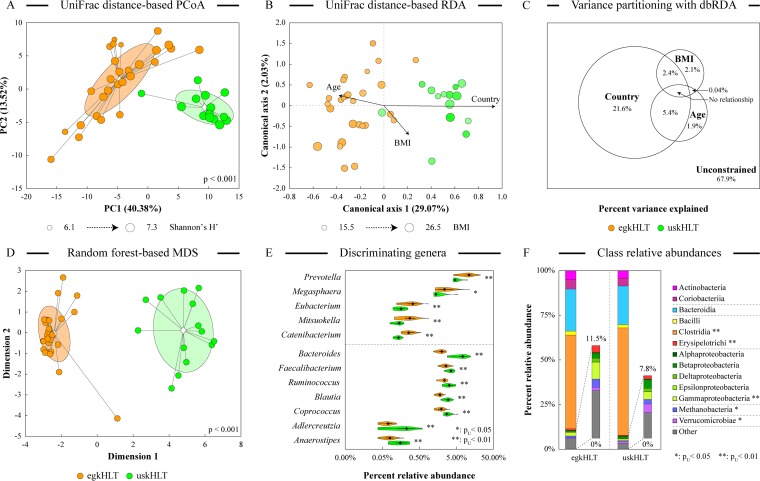
FIG 1 .
Comparison of distal gut microbiota composition between Egyptian and U.S. groups. (A and B) Sample similarity was assessed by unconstrained weighted UniFrac-based principal-coordinate analysis (A) and constrained weighted UniFrac-based redundancy analysis (B) run on the chord-transformed genus abundance data set. The statistical significance of group separation in PCoA is based on the Davies-Bouldin index. Group clouds represent areas of three standard errors around the group centroid (diamond), and dot sizes in PCoA are proportional to Shannon’s H′ alpha diversity values for that sample. Distance-based RDA used three explanatory variables (group, age, and body mass index). The age and the BMI of the subjects are represented by color gradients and the size of each dot, respectively. Arrows in the db-RDA biplot denote the magnitudes and directions of the effects of explanatory variables. (C) A variation partitioning diagram depicts the relative contributions of explanatory variables to the overall variability in the data set. (D) Results of random forest discriminant analysis of chord-transformed genus abundances were visualized through multidimensional scaling of the sample proximity matrix. The statistical significance of group separation is based on the Davies-Bouldin index. Group clouds represent areas of three standard errors around the group centroid (diamond). MDS, multidimensional scaling. (E) The relative abundances of the top 12 RF discriminatory genera are depicted on a violin plot. Each violin shows the density distribution of genus abundances among all samples in the group. (F) Community structure at the class level. Classes are ordered according to the phylum. Where shown, single asterisks (*) and double asterisks (**) indicate statistical significance of taxon abundance differences between two groups (pu < 0.05 and pu < 0.01, respectively) based on the FDR-adjusted Mann-Whitney U test.

