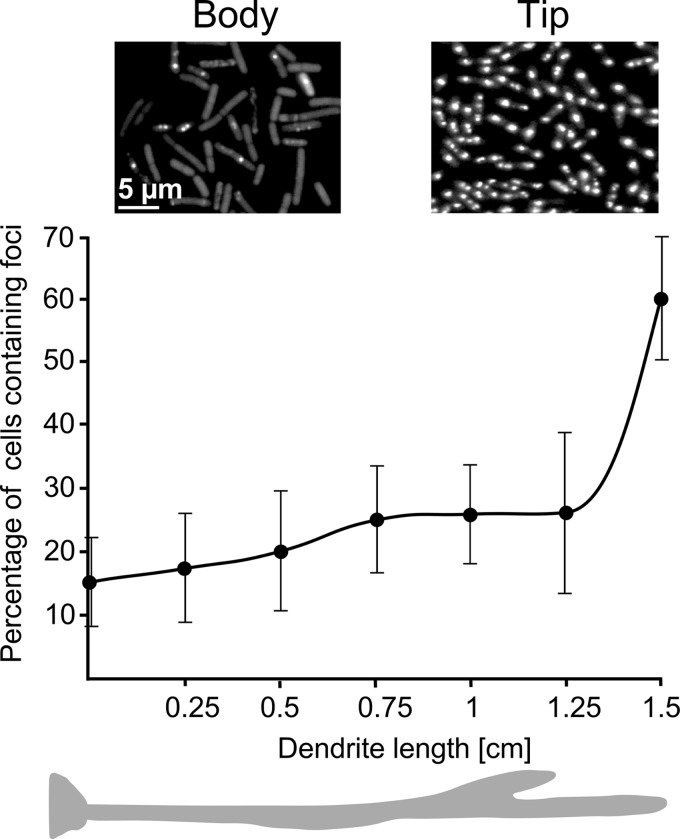
FIG 3 .
Spatiotemporal expression of the DnaN subunit of DNA polymerase. The images taken in situ show the production of a GFP-DnaN protein fusion in cells located in the dendrite body and the tip of the swarming community (strain SSB2022). The graph shows the percentages of fluorescent foci in individual cells measured every 2.5 mm along the dendrite. Error bars represent the standard deviations of the means.

