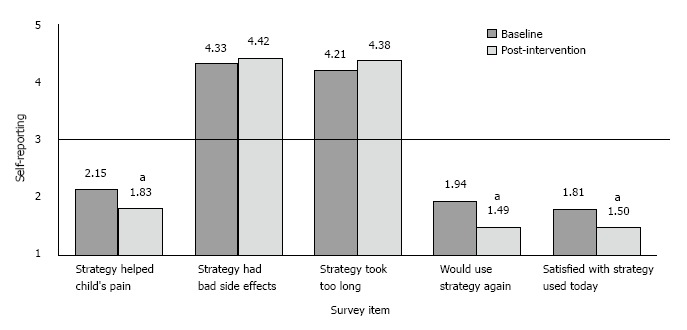
Figure 1.

Comparison of parent/caregiver self-reported satisfaction with pain prevention strategies used at visit at baseline (n = 85) and at post-intervention follow up (n = 101) via parent/caregiver survey. A value of 3 indicates the neutral point; scores above 3 indicate more concern/negative response about this area, while a value below 3 indicates less concern/more positive response. aP < 0.05 vs Baseline.
