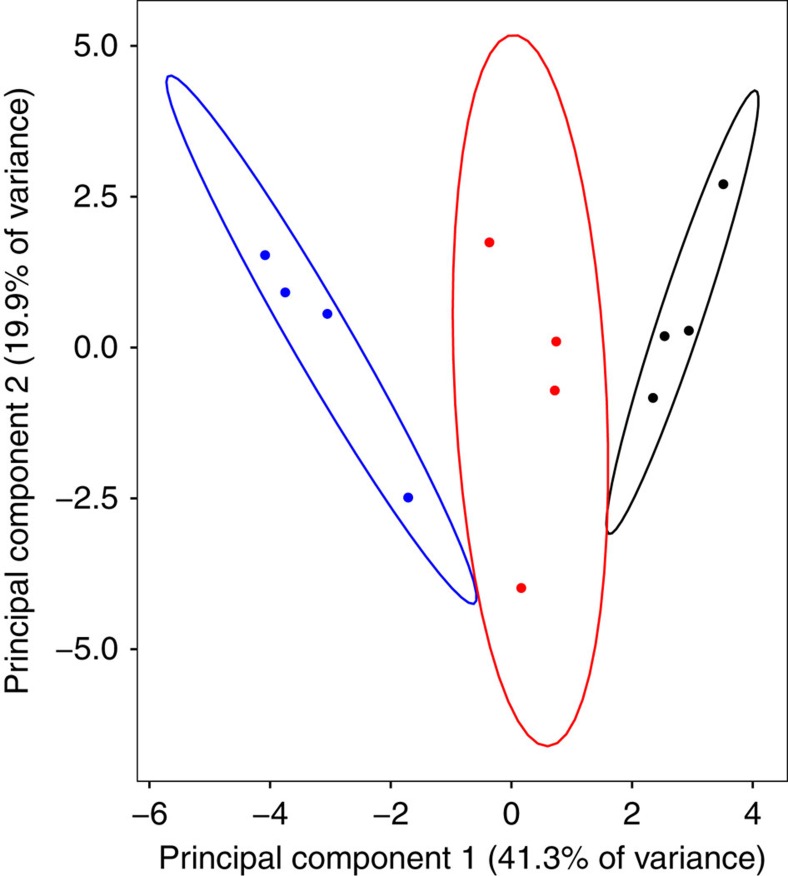
Figure 2. Principal component analysis of neuropeptide relative abundances.
Graph of the association between abundances and three non-parenting and parenting behavioural states of Nicrophorus vespilloides (red: virgin, black: actively parenting, blue: post-parenting). Principal component analysis (PCA) based on four biological replicates of each behavioural state, with eight individual brains pooled to form a biological sample. Ellipses show the 95% confidence area of each group.

