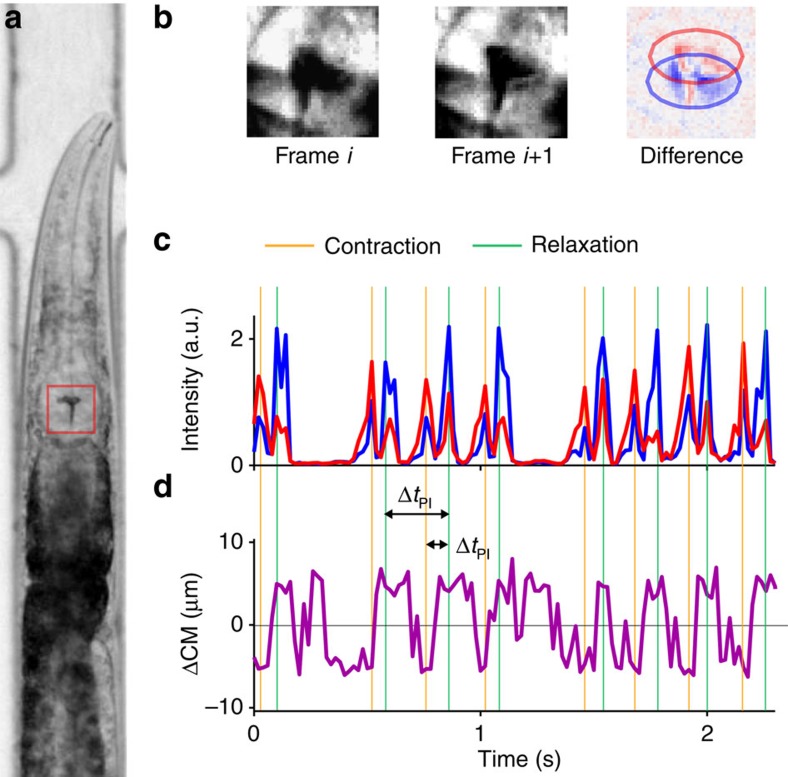
Figure 1. Automated detection of pumping dynamics.
(a) Bright-field image of a worm confined in a custom microfluidic device for longitudinal recording of pumping dynamics. (b) Images of a small region surrounding the pharyngeal grinder (red box in a) at two consecutive frames and the difference between the two. Pixels that turn darker and pixels that become brighter are coloured in red and blue, respectively. (c) Representative time courses of the total intensity of the red- and blue-marked pixels. Peaks in these measures are robust indicators of a pharyngeal motion, either contraction or relaxation. (d) Representative time courses of the displacement between the centrr of mass of the red- and blue-marked pixels. Positive values occur when the blue centre of mass is posterior to the red one, indicating a relaxation motion.

