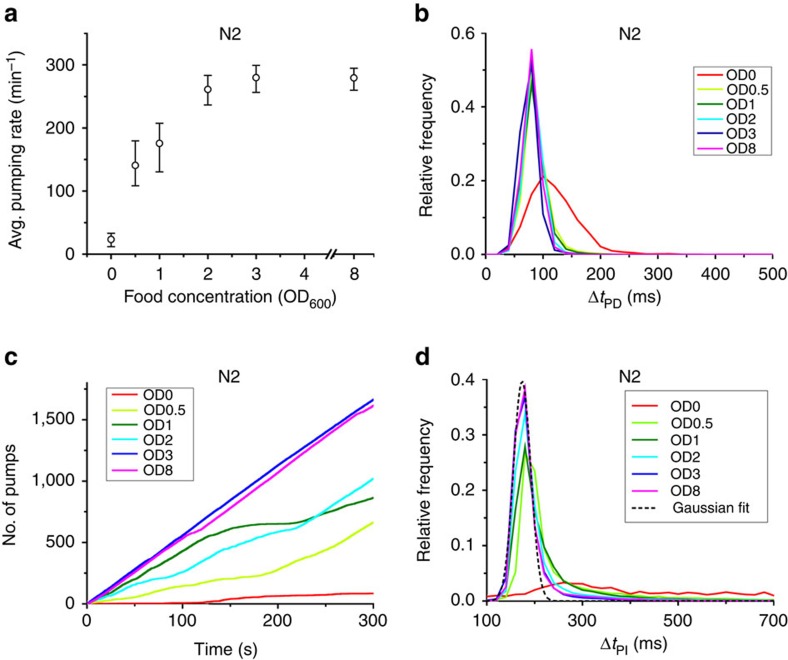
Figure 2. Pumping dynamics are modulated in response to food availability.
(a) Average pumping rate as a function of food concentration. The rates are averaged over all worms and all recorded periods at each concentration. Error bars are 95% confidence intervals, calculated from an ensemble of all 10-min subsets of the data. Sample sizes are given in Supplementary Table 2. (b) The distributions of pump duration ΔtPD. (c) Representative time series of pumping by individual worms at different food concentrations. Plotted is the total numbers of pumps counted since the beginning of the experiment (defined as time=0). (d) Histogram of pulse intervals, ΔtPI. These histograms show a narrow peak and a heavy tail. One of these peaks was fit to a Gaussian distribution (black dashed line) centred at 174 ms, with the s.d. of 20 ms (adjusted R2=0.985).

