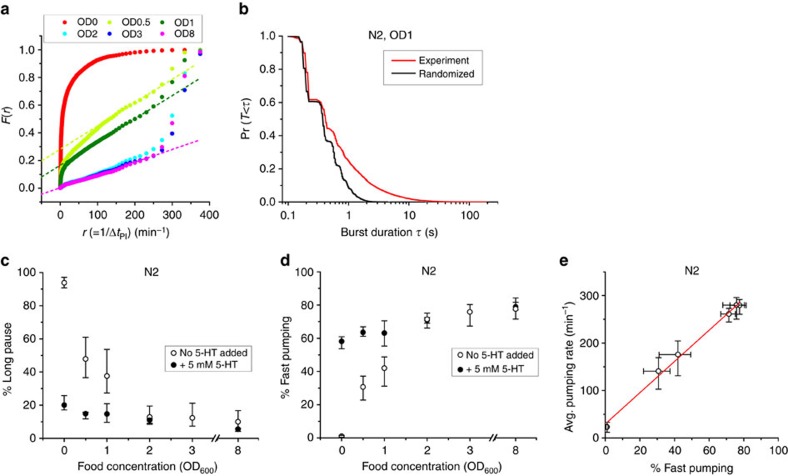
Figure 3. Bursts of fast pumping are a primary response to food availability.
(a) F(r), the fraction of time spent in intervals longer than 1/r at various food concentrations. Dashed lines for (OD600=0.5, 1 and 8) are the best-fit lines between 100 pumps per min and 250 pumps per min. Sample sizes are given in Supplementary Table 2. (b) Survival probability of the durations of fast pumping bursts at OD600=1 (black). Red curve is the burst durations calculated from the same pumping intervals in randomized order. (c,d) The average fraction of time spent by worms in long pauses (c) and fast pumping (d) at different food concentrations. Empty symbols, no added serotonin; filled symbols, in media supplemented with 5 mM serotonin. Error bars as in Fig. 2. (e) Average pumping rates plotted against the fraction of fast pumping at different food concentrations. Red line is a linear fit to the data.

