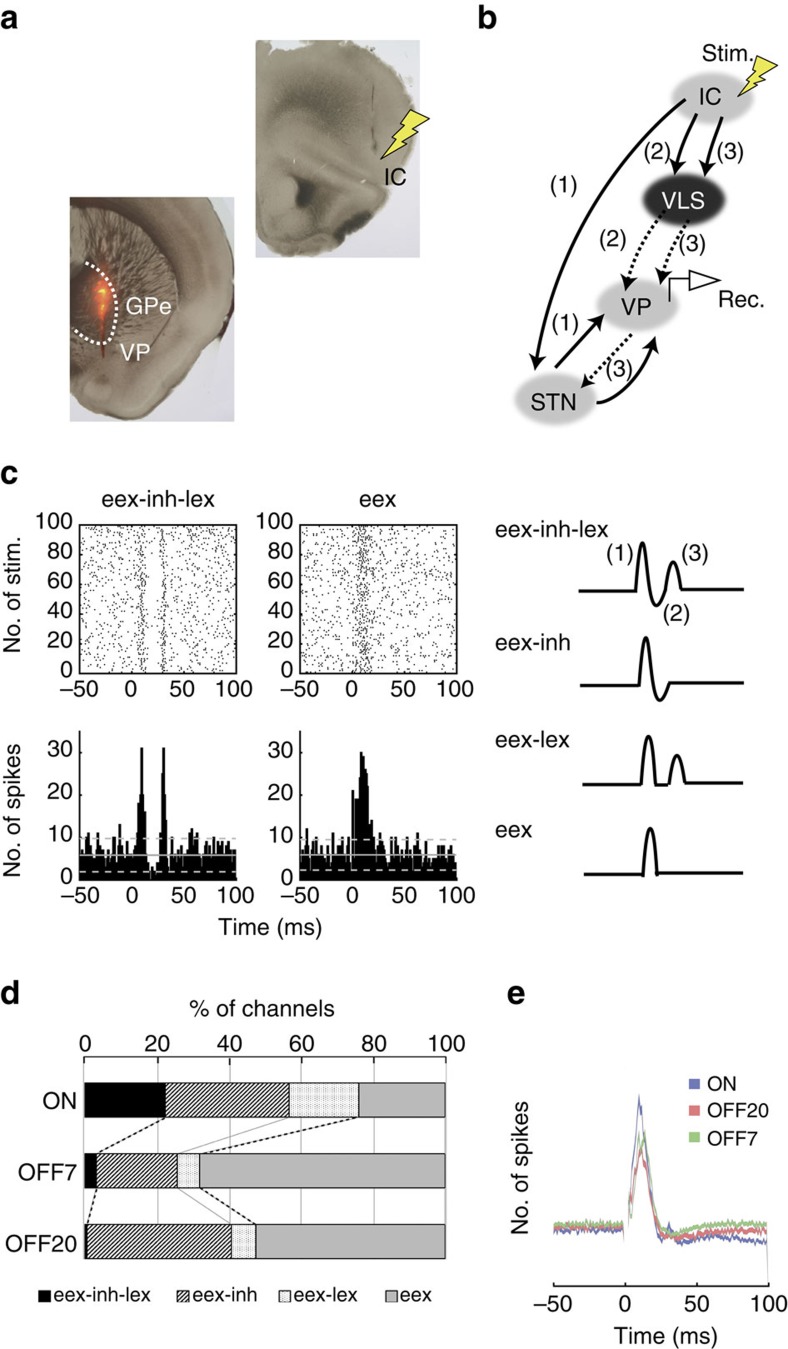
Figure 3. Electrophysiological characterization of DTA-exposed but viable D2-MSNs.
(a). Positions of stimulation (arrow at the insular cortex (IC)) and recording (red) are shown. Note that the ventral pallidum (VP) is located beneath the globus pallidus externa (GPe) in this AP position. (b) Schematic representation of the pathways from the stimulation site to the recording site. Pathway 1 (IC-subthalamic nucleus (STN) -VP) drives the early excitation; pathway 2 drives inhibition (IC-VLS-VP); pathway 3 (IC-VLS-VP-STN-VP) drives the late excitation. Solid and dotted lines represent glutamatergic and GABAergic pathways, respectively. (c) Raster and PSTHs of the typical patterns of eex-inh-lex and eex of VP neurons. Cortical stimulation (200 μs duration single pulse, 200 μA strength) was delivered at time 0 for 100 stimulus trials. The mean firing frequency and statistical levels of P<0.05 (one-tailed t-test) calculated from the 100 ms period preceding the onset of stimulation are indicated by solid lines (mean) and dotted lines (statistical levels), respectively. Four patterns (eex-inh-lex, eex-inh, eex-lex, eex) were classified. eex indicates early-excitation; inh, inhibition; lex indicates late-excitation. (d) Proportions of VP neurons (% of traces) classified according to the response patterns evoked by the IC stimulation in controls and D2-DTA DOX-off mice. % of VP neurons with inh and/or lex (patterns with eex-inh-lex, eex-inh and eex-lex in total) was lower in D2-DTA DOX-off mice. (e) Difference in the population PSTHs of VP neurons among D2-DTA DOX-on, DOX-off day 7, and DOX-off day 20 groups. The light-shaded colours represent±s.e.m.

