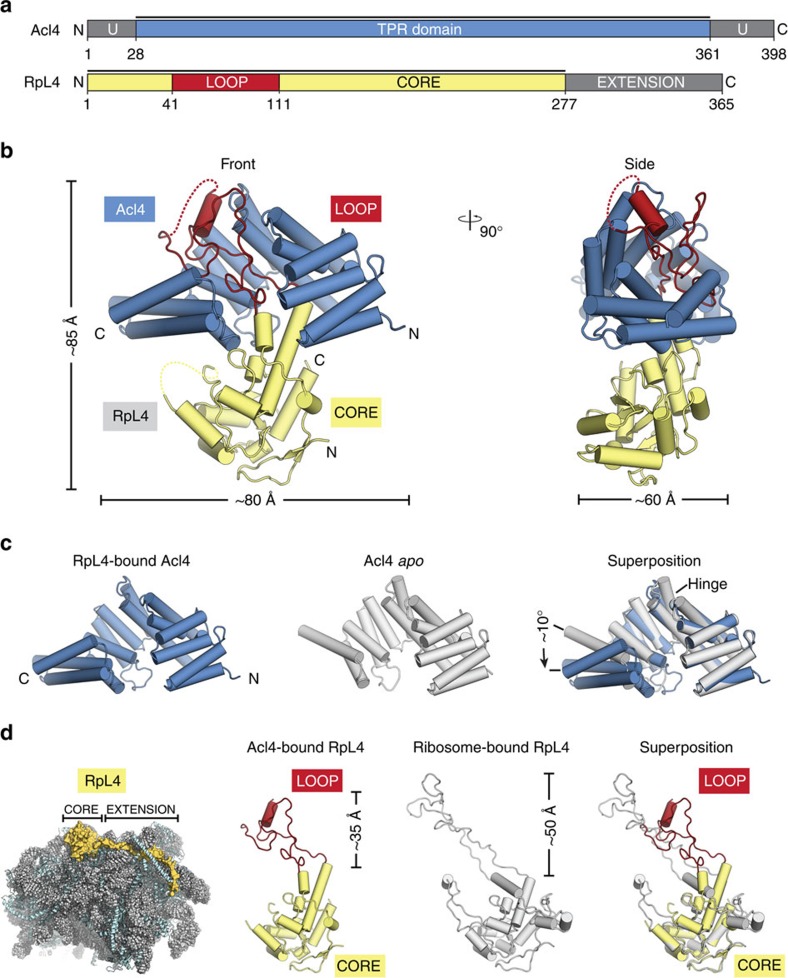
Figure 1. Analysis of the Acl4·RpL4 structure.
(a) Domain representation of Acl4 and RpL4 from Chaetomium thermophilum. Acl4: unstructured N- and C-terminal regions (dark grey); central TPR domain (blue). RpL4: core (yellow); loop (red); C-terminal extension (dark grey). Black bars represent crystallized fragments. (b) Crystal structure of the Chaetomium thermophilum Acl4·RpL4 complex, shown in cartoon representation. A 90° rotation is shown on the right. Colouring is according to panel a. (c) Superposition of RpL4-bound Acl4 (blue) with Acl4 apo (grey) (PDB ID 4YNV)10. (d) Cartoon representation of the S. cerevisiae large ribosomal subunit (PDB ID 4V88) showing RNA (grey), proteins (teal), and RpL4 (yellow)17. Superposition of Acl4-bound RpL4 with ribosome-bound RpL4 (grey).

