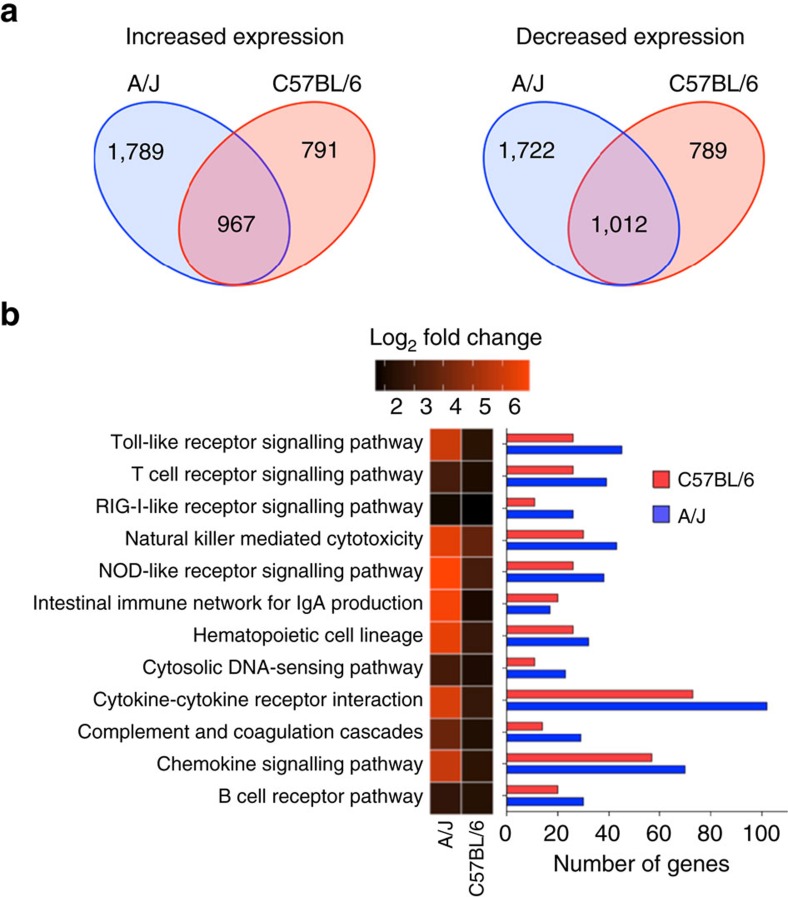
Figure 2. Gene expression analysis of S. aureus-infected kidneys from A/J and C57BL/6 mice.
(a) Venn diagram showing the number of DEGs with increased (left) or decreased (right) expression in response to S. aureus infection that are unique or common between A/J and C57BL/6 mice. (b) Heat map of the mean log2-fold change of gene expression of the significantly up-regulated genes determined between S. aureus-infected versus uninfected A/J and C57BL/6 mice within the KEGG ‘immune system' category (left part). The corresponding numbers of significantly up-regulated genes in response to S. aureus infection in A/J (blue bars) and C57BL/6 (red bars) are shown in the right part of the figure.

