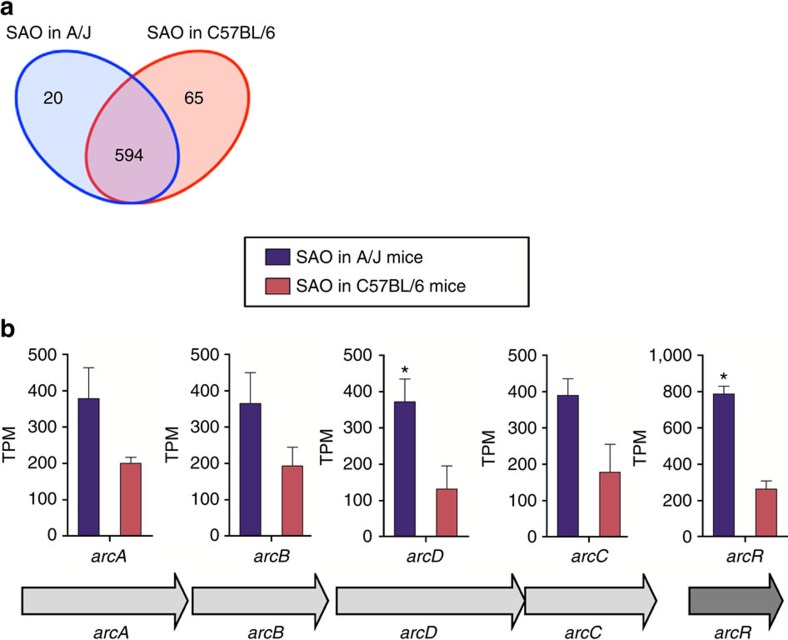
Figure 3. Gene expression analysis of S. aureus during infection of A/J and C57BL/6 mice.
(a) Venn diagram showing the number of unique and common expressed genes between S. aureus infecting A/J and C57BL/6 mice based on differential gene expression analysis determined with NOISeq. (b) Gene composition and organization of the genes of the ADI operon and their level of expression in S. aureus during infection of A/J (blue bars) or C57BL/6 (red bars) mice. Each bar represents the mean of TPM±s.d. of triplicates.

