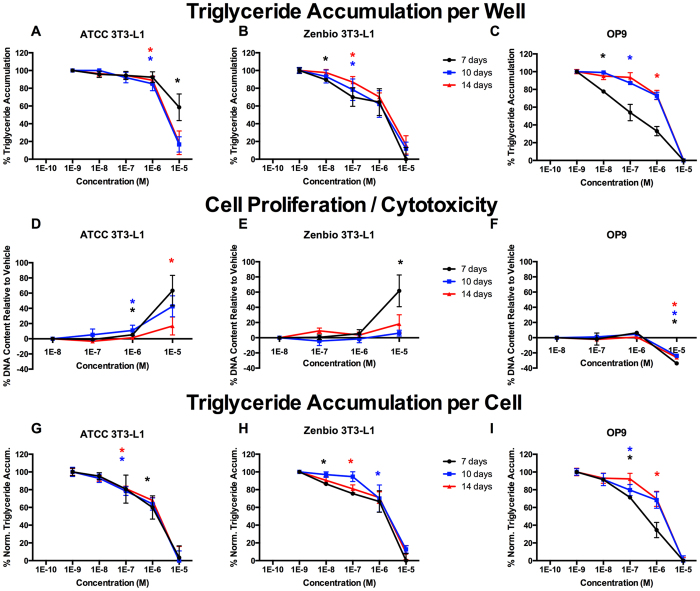
Figure 4. GW9662 Induces Varied Adipogenic Inhibition Based on Induction Time.
ATCC 3T3-L1, Zenbio 3T3-L1, and OP9 cells were differentiated as described in Methods and assessed for adipocyte differentiation (Nile Red staining of lipid accumulation) and cell proliferation (Hoechst staining) at various times after initiation of differentiation. Percent raw triglyceride inhibition of half maximal rosiglitazone per well for GW9662 at 7 days (A), 10 days (B), and 14 days (C). Increase (cell proliferation) or decrease (potential cytotoxicity) in DNA content relative to vehicle control for GW9662 at 7 days (D), 10 days (E), and 14 days (F). Percent normalized triglyceride accumulation per cell (normalized to DNA content) for GW9662 at 7 days (G), 10 days (H), and 14 days (I). Data presented as mean ± SE from three independent experiments. *Indicates lowest concentration with significant increase in triglyceride over vehicle control, p < 0.05, as per linear mixed model in SAS 9.4.

