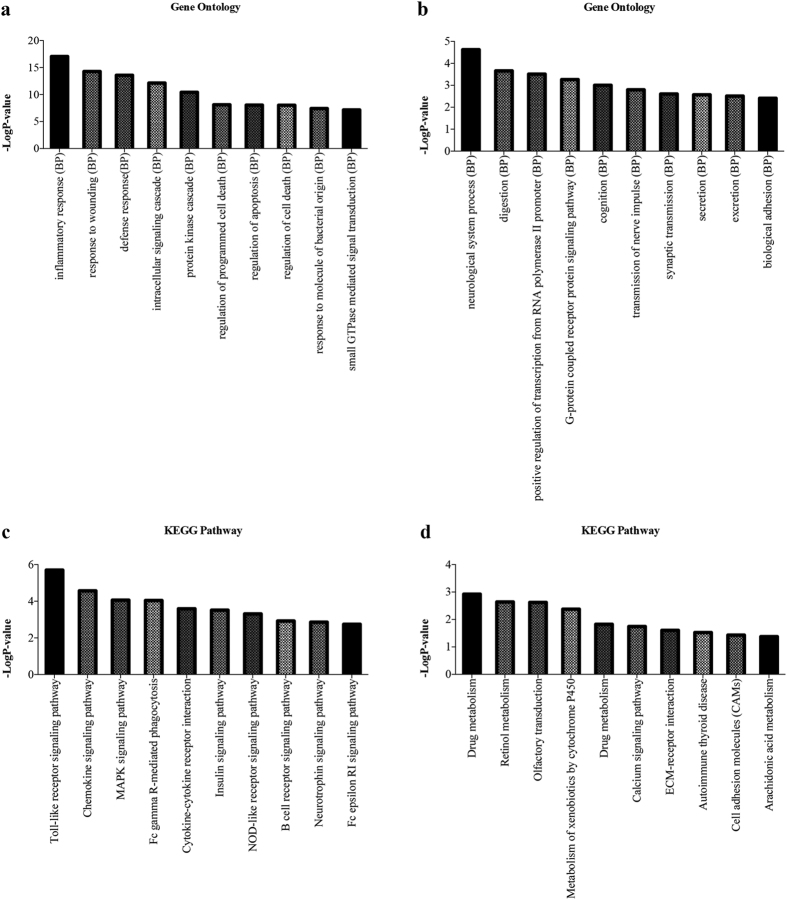
Figure 4. Gene ontology and KEGG Pathway analysis of 2624 differentially expressed mRNAs.
(a) The top 10 GO terms upregulated in MMD patients compared with healthy controls. (b) The top 10 GO terms downregulated in MMD patients compared with healthy controls. (c) The top 10 pathways upregulated in MMD patients compared with healthy controls. (d) The top 10 pathways downregulated in MMD patients compared with healthy controls.

