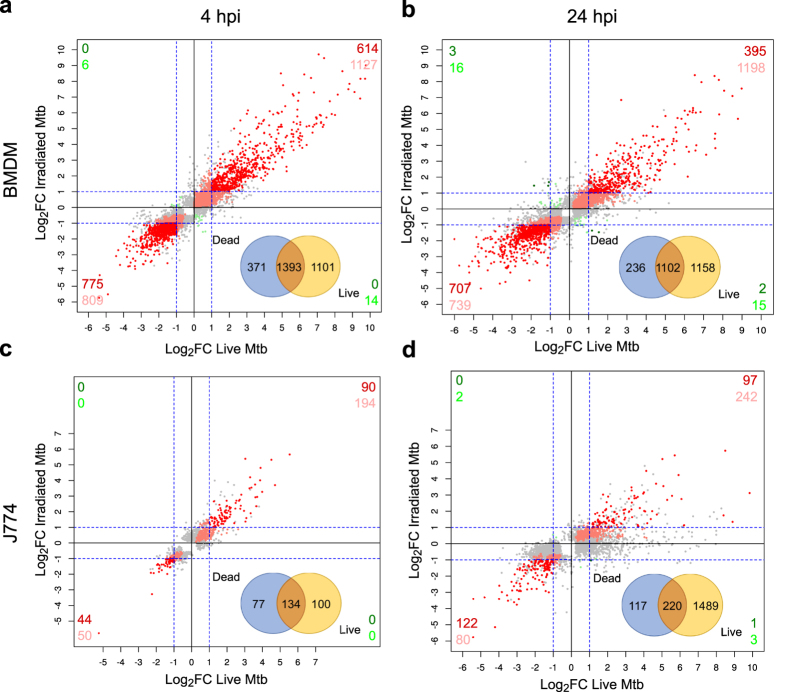
Figure 4. Comparison of the response of BMDMs and J774 to infection with live bacteria and stimulation with dead M. tuberculosis.
Scatterplots comparing the Log2 fold change (FC) of all the differentially expressed genes (DEGs) in BMDMs at 4 hpi (a) and 24 hpi (b), and J774 at 4 hpi (c) and 24 hpi (d). Grey dots represent genes differentially expressed in one condition only. Points in shades of red represent genes differentially expressed in both data sets in the same direction. Points in shades of green represent genes differentially expressed in opposite direction. Those showing FC < |2| in either/both condition(s) are shown in light colour and those with FC > |2| in both conditions are shown in dark. The number of genes are indicated for each quadrant. A Venn diagram showing the number of DEGs in macrophages infected with live bacteria and/or stimulated with dead bacteria is shown for each macrophage type and time point.

