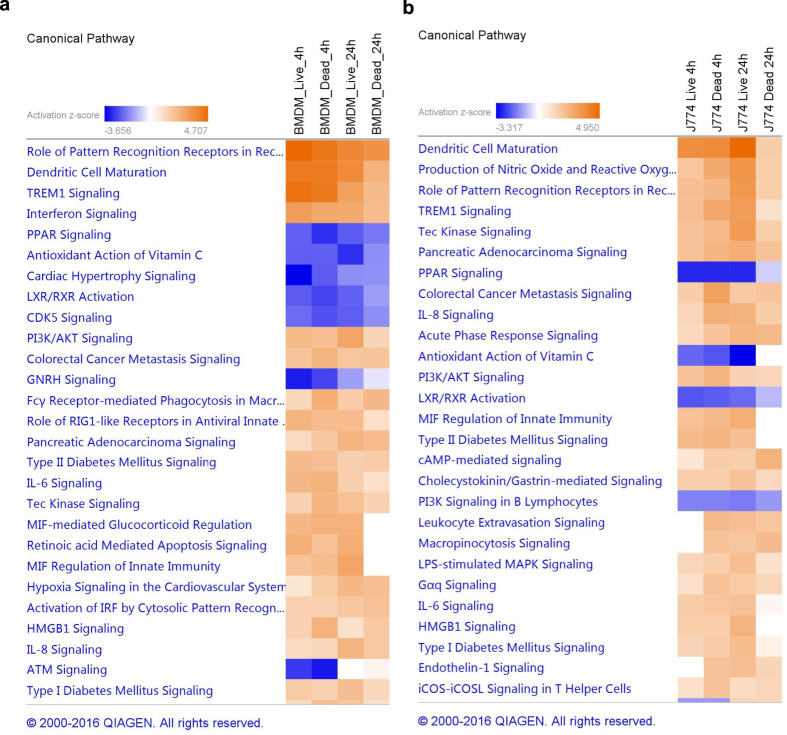
Figure 5. Top enriched pathways in macrophages infected with live bacteria and stimulated with dead M. tuberculosis.
(a) BMDMs, and (b) J774 cells. Data were analysed through the use of QIAGEN’s Ingenuity® Pathway Analysis (IPA®, QIAGEN Redwood City, www.qiagen.com/ingenuity). Pathways are ranked according to the Z-score that predicts activation/repression.

