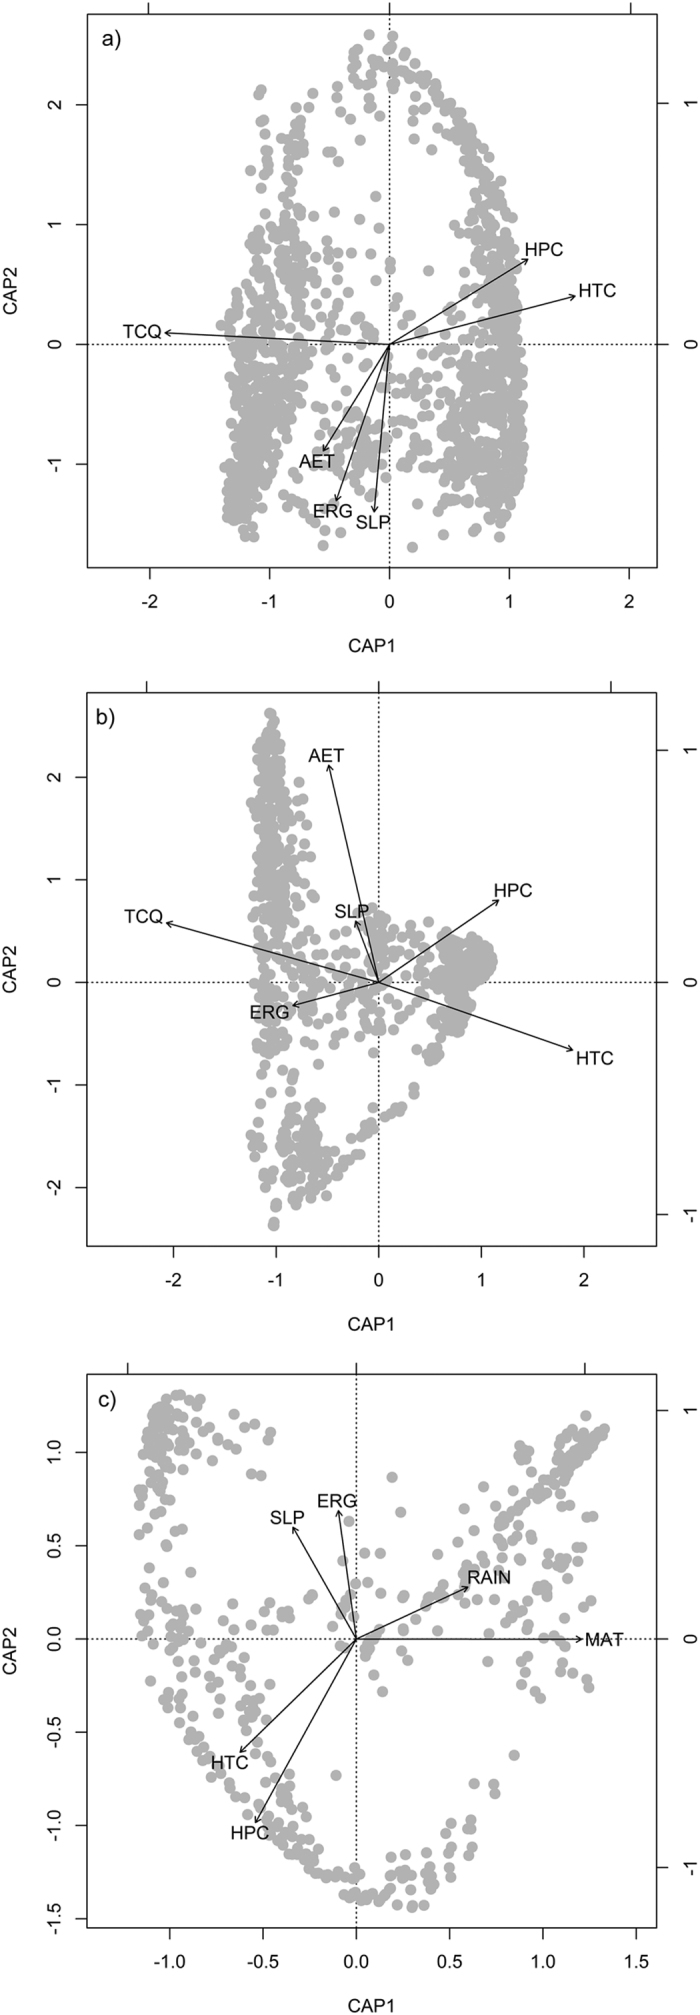
Figure 3. Biplots of distance-based redundancy analysis showing the relationships between Salix species composition and environmental factors at the spatial resolution of 100 × 100 km in eastern Asia.

(a) The whole region; (b) mountains; (c) lowlands. MAT, mean annual temperature; TCQ, mean temperature of coldest quarter; AET, actual annual evapotranspiration; RAIN, total precipitation of the months with mean monthly temperature >0 °C; HTC, anomaly of temperature between the Last Glacial Maximum and the present; HPC, anomaly of precipitation between the Last Glacial Maximum and the present; SLP, mean slope; ERG, elevation range.
