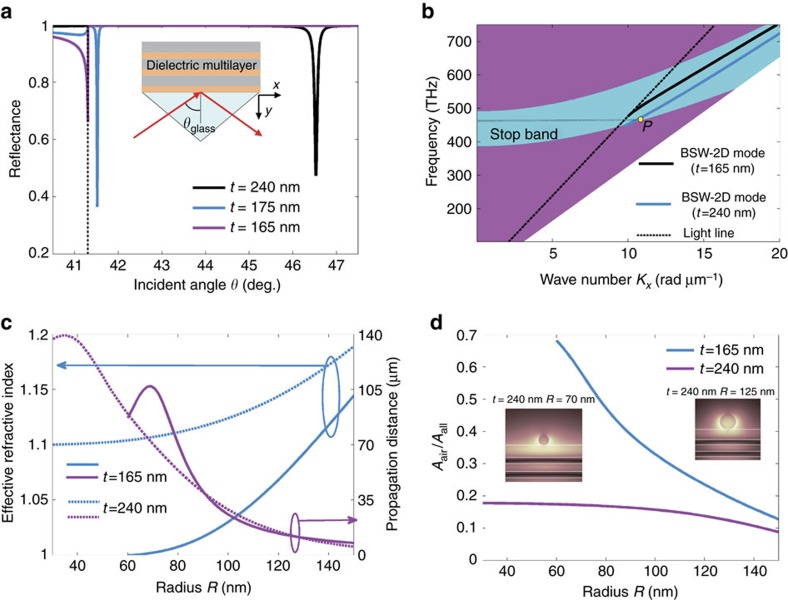
Figure 3. Numerical comparisons of DLBSW and BSW-1D modes.
(a) Calculated reflectance of the dielectric multilayer versus incident angle under TE illumination for different thicknesses t of the top SiO2 layer. The dotted line denotes the critical angle between the glass substrate and air. (b) The TE waves band structure for the dielectric multilayer. The turquoise zone is the stop band. The dispersion relations for BSW-2D modes with t=165 nm (magenta line) and t=240 nm (blue line) are also demonstrated. The dashed line denotes the light line in air. The point P is corresponding to the excitation wavelength 633 nm. (c) The effective refractive indexes and the propagation distance of the BSW-1D (t=165 nm) and DLBSW (t=240 nm) modes as a function of the nanofibre radius; (d) the ratio of mode energy (Aair/Aall) for DLBSW and BSW-1D modes versus the nanofibre radius. The insets show the electric field distributions for different nanofibre radius (R=70 nm and R=125 nm) with t=240 nm.

