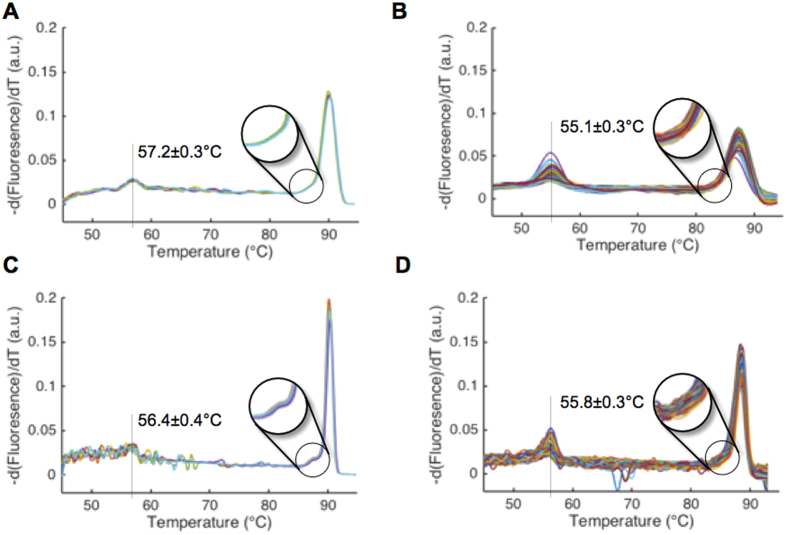
Figure 3. U-dHRM sampling and ramp rate optimization on-chip.
(A,B) L. monocytogenes melt curves generated with a low imaging rate on qPCR HRM and U-dHRM platforms respectively. (C,D) L. monocytogenes melt curves generated using a high imaging rate on qPCR HRM and U-dHRM platforms respectively. The synthetic temperature calibrator sequence mean melting temperature and standard deviation are shown in all. Black circle highlights a melt curve shape feature unique to L. monocytogenes 16S sequence, which is dependent on sampling rate.

