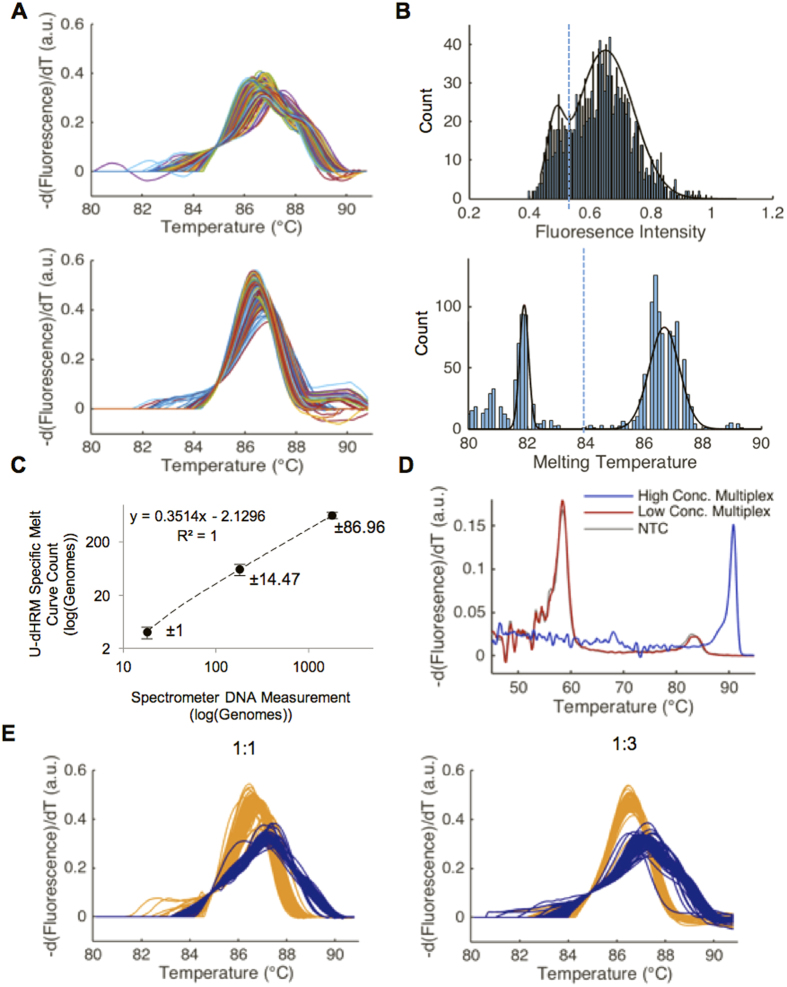
Figure 4. OVO SVM classification of L. monocytogenes and S. pneumoniae.
(A) Two-thousand normalized S. pneumoniae (top) and L. monocytogenes (bottom) U-dHRM melt curves aligned to 0.1 –dF/dT, respectively. These curves were used to train the OVO SVM to classify each bacteria. (B) Histogram of fluorescence intensity values of digital reaction wells with PDF overlay and the intensity value chosen to classify positive from negative marked by dotted line (top). Histogram showing the Tm of each digital reaction with PDF overlay and the Tm value chosen to classify positive from negative marked by dotted line (bottom). Both graphs correspond to a concentration of 458 genomes of L. monocytogenes per chip. (C) U-dHRM dilution series of L. monocytogenes with U-dHRM measured values plotted against spectrometer measured values for DNA content. The sample mean and sample standard deviation are shown. (D) In blue: qPCR melt curve generated from a 1:1 mix of 20 ng total DNA input of S. pneumoniae and L. monocytogenes. In red: qPCR melt curve generated from a 1:1 mix of 0.02 ng total DNA input of S. pneumoniae and L. monocytogenes. This concentration and reaction mixture is similar to that used for digital chip experiments. In grey: qPCR melt curve generated from a negative template control (NTC) with no bacterial DNA added. (E) U-dHRM and OVO SVM classification of L. monocytogenes and S. pneumoniae in two distinct mixture compositions, demonstrating polymicrobial detection capability. Table 2 shows enumeration of detected curves in panel E.

