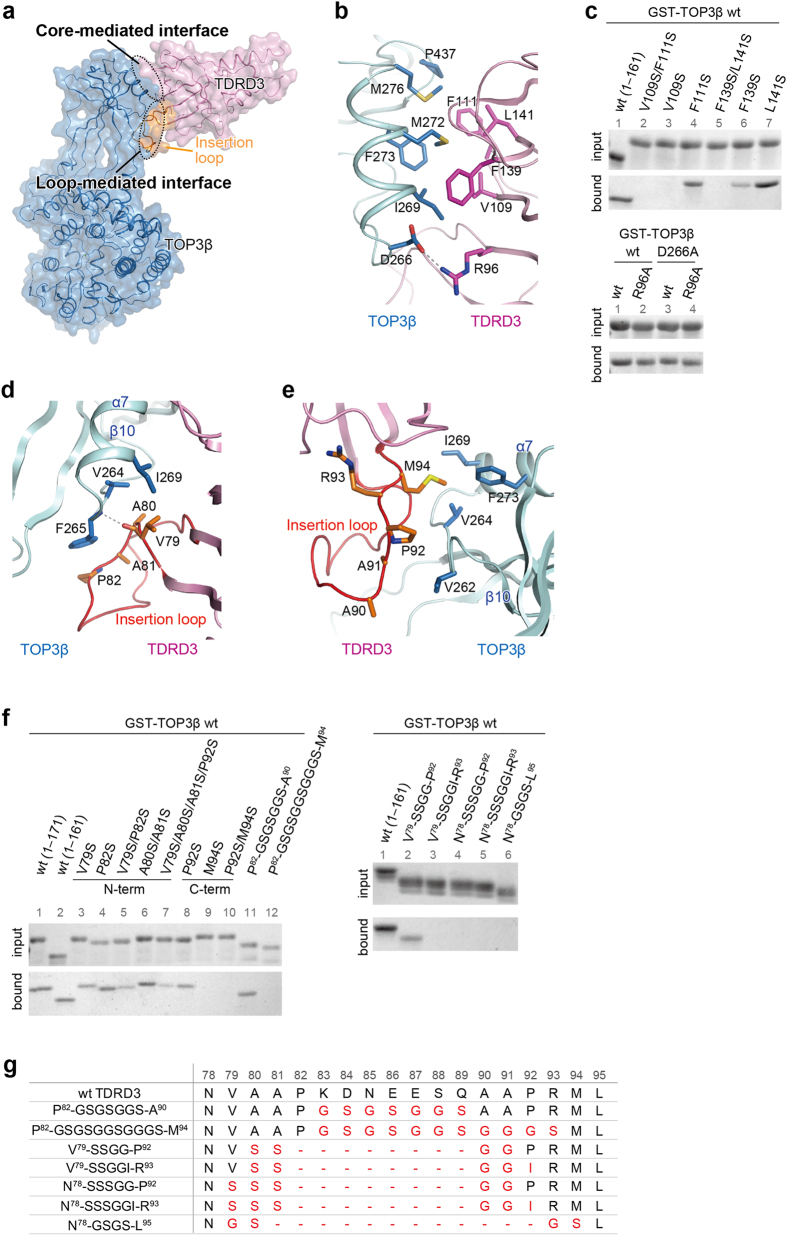
Figure 3. Interactions between TOP3β and TDRD3.
(a) Surface representation of the TOP3β–TDRD3 complex. TDRD3 is colored in pink, except that the insertion loop is colored in orange. TOP3β is colored in blue. The core- and loop-mediated interfaces are encircled by dotted lines. (b) The core-mediated interactions between TOP3β and TDRD3. (c) GST pull-down assays of TDRD3 mutants to assess the core-mediated interactions. The GST-TOP3β-bound resins were incubated with 0.5 μM TDRD3 wild-type or mutant proteins. Shown are the cropped gel images. The contrast was adjusted for clarity. Quantitative analyses and original full-length gel images corresponding to the top and bottom panels are shown in Supplementary Fig. 5a,b, respectively. (d) Interactions between TOP3β and the N-terminal region of the TDRD3 insertion loop. (e) Interactions between TOP3β and the C-terminal region of the TDRD3 insertion loop. (f) GST pull-down assays of TDRD3 mutants to assess the loop-mediated interactions. The GST-TOP3β-bound resins were incubated with 0.2 μM or 1.0 μM TDRD3 proteins shown in left or right panels, respectively. Shown are the cropped gel images. The contrast was adjusted for clarity. Quantitative analyses and original full-length gel images corresponding to the left and right panels are shown in Supplementary Fig. 5c,d, respectively. (g) Amino-acid sequences of the insertion loop in the TDRD3 mutants shown in (f). The residue numbers of wild-type TDRD3 are shown in the top. The mutated residues are colored in red.

