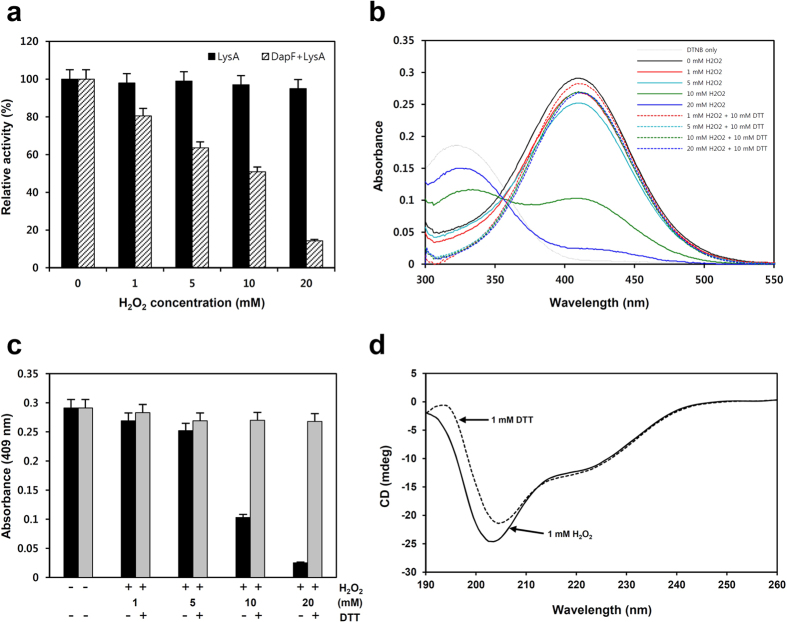
Figure 4. Redox sensitivity of CgDapF.
(a) Susceptibility of CgDapF to hydrogen peroxide (H2O2). The CgDapF protein was treated with various concentration of H2O2 and DapF activity was measured. To test the effect of H2O2 on LysA, LysA activity with various concentrations of H2O2 were also measured. (b) UV/Vis spectra of CgDapF depending on redox state. The filled-lines indicate the UV/Vis spectra of CgDapF with various concentration of H2O2, and the dotted-lines indicate those after switch of the redox states to the reduced condition by addition of 10 mM DTT. (c) Absorbance at 409 nm of CgDapF depending on redox state. The absorbance values at 409 nm from the Uv/vis spectra of (b) are compared. (d) The far-UV CD spectra of CgDapF in different redox conditions. Structural changes of CgDapF depending on different redox conditions are measured using the far-UV CD spectra. For the reduced and the oxidized condition, 1 mM each of DTT and H2O2 are added to the CgDapF protein, respectively.

