
Figure 4.
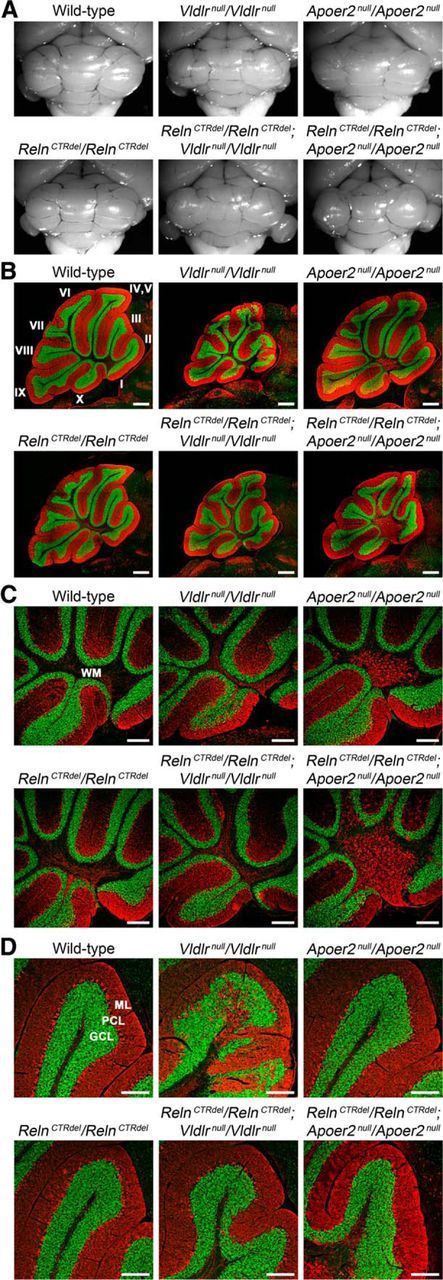
Differential genetic interaction with Apoer2null and Vldlrnull mice in the cerebellum. A, Gross morphology of the cerebellum. B–D, Immunohistochemistry images of P21 brain sagittal sections at the level of the vermis are shown. Anti-calbindin (red, Purkinje cells) and anti-NeuN (green, granule cells) antibodies were used. B, RelnCTRdel/Apoer2null double-homozygote mice display a smaller and less foliated cerebellum than either mutant alone. RelnCTRdel/Vldlrnull double-homozygote display a foliation pattern similar to that of Vldlrnull mice. Ten cerebellar lobules (I–X) are labeled. Scale bar, 500 μm. C, High-magnification images of the cerebellar white matter (WM) region taken from the same section shown in B. RelnCTRdel/Apoer2null double homozygote mice, as well as Apoer2null mice, have ectopically localized calbindin-expressing Purkinje cells (red) at the level of the vermis. Scale bar, 250 μm. D, High-magnification images of the cerebellar granule cell layer (GCL) taken from the same section shown in B. Disorganized layers of the granule cells and Purkinje cells (PCL) seen in Vldlrnull mice are less severe in RelnCTRdel/Vldlrnull mice. ML, molecular layer. Scale bar, 200 μm.