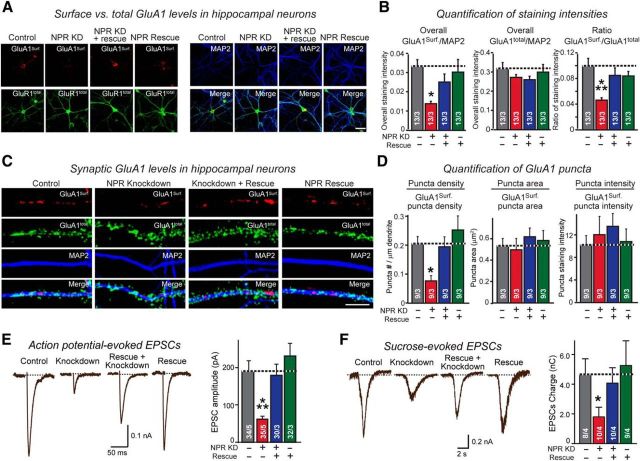
Figure 11.
NPR knockdown impairs GluA1 content and transmission strength of excitatory synapses. A, B, NPR knockdown decreases the overall surface levels of GluA1, but not total GluA1 levels. Hippocampal neurons were infected control lentiviruses or lentiviruses expressing NPR shRNAs, NPR shRNAs plus shRNA-resistant cDNA, or only the NPR cDNA at DIV4. Neurons were immunolabeled at DIV16 in separate experiments for surface GluA1 receptors before permeabilization (red), and then permeabilized and stained for total GluA1 receptors using a different secondary antibody (green), and additionally stained for MAP2 (blue). A, Representative images. B, Summary graphs of the surface GluA1 levels and total GluA1 levels normalized for MAP2 as an internal standard as well as of the ratio of surface to total GluA1 levels. C, D, NPR KD reduces the density of GluA1-positive synaptic puncta but has no apparent effect on the GluA1 content of such puncta. Hippocampal neurons obtained as described for A and B, and synaptic puncta were imaged in neurons obtained. The density, area, and staining intensity of puncta were quantified. C, Representative images. D, Summary graphs. E, NPR knockdown decreases the amplitude of action potential-evoked EPSCs. Control neurons and neurons with the NPR knockdown without or with rescue were produced as described for A and B, and EPSCs were monitored in whole-cell patch-clamp recordings after stimulation with a multicentric extracellular electrode in the presence of 0.1 mm PTX. Left, Representative traces. Right, Summary graphs of the peak EPSC amplitudes. F, NPR knockdown decreases the total synaptic charge transfer at excitatory synapses after stimulation of neurotransmitter release with hypertonic sucrose, which triggers release of all transmitters in readily-releasable vesicles (Rosenmund and Stevens, 1996). Control and NPR knockdown neurons were analyzed by whole-cell recordings as described for E, except that recordings were performed in the presence of 0.1 mm PTX and 1 μm TTX, and that presynaptic neurotransmitter release was induced by application of 0.5 m sucrose for 30 s. EPSCs were quantified by integrating the total charge transfer during the sucrose application. Left, Representative traces. Right, Summary graph of the total charge transfer. Scale bars: A, 50 μm; C, 10 μm. Graphs represent mean ± SEM. Numbers in bars indicate number of neurons/experiments analyzed. Statistical significance: B, D, One-way ANOVA test with Tukey's post hoc test; E, F, Student's t test. *p < 0.05. ***p < 0.001.

