Figure 4.

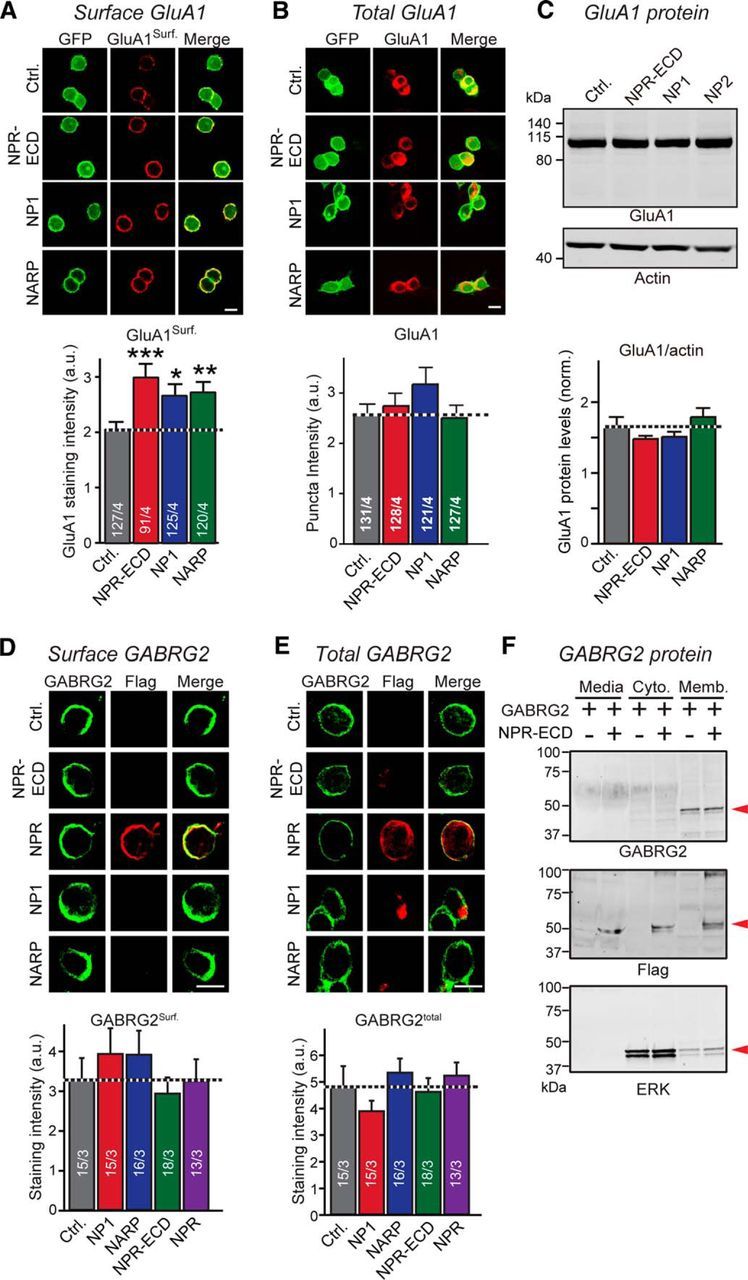
NPR, NP1, and NARP binding increases surface levels of GluA1, but not of GABRG2 in HEK293T cells. A, Neuronal pentraxins stabilize surface levels of GluA1 in HEK293T cells. Surface GluA1 levels were measured in HEK293T cells expressing NPR-ECD-Flag, NP1-Flag-His, NARP-Flag-His, or control plasmid together with GluA1-IRES GFP and stargazin-YFP. Nonpermeabilized cells were stained with an antibody that recognizes the GluA1-NTD. Top, Representative images. Bottom, Summary graph. B, Same as A, except measuring total level of GluA1 in HEK293T cells transfected. Transfected cells were stained with permeabilization using a GluA1 antibody. Top, Representative images. Bottom, Summary graph. C, Total GluA1 levels are unchanged by neuronal pentraxins. Total GluA1 protein levels were measured in HEK293T cells transfected as in A and B by quantitative immunoblotting, using actin as an internal control. Top, Representative blots. Bottom, Summary graph. D, Neuronal pentraxins do not affect surface stabilization of GABRG2 in HEK293 cells. Surface GABRG2 levels were measured in HEK293 cells expressing NP1-Flag-His, NARP-Flag-His, NPR-ECD-Flag, NPR-Flag, or control plasmid together with GABRG2. Nonpermeabilized cells were stained with an antibody recognizes the GABRG2 (green) and Flag (red). Top, Representative images. Bottom, Summary graph. E, Same as D, except measuring total level of GABRG2 in HEK293 cells transfected. Transfected cells were stained with permeabilization using a GABRG2 antibody. Top, Representative images. Bottom, Summary graph. F, Extracellular (Media), membranous (Memb.), and cytosolic (Cyto.) protein levels of GABRG2 were measured. Lysates from HEK293 cells expressing GABRG2 together with NPR-ECD-Flag or control plasmid were collected after subcellular fractionation. GABRG2, NPR-ECD, and ERK (subcellular fraction marker) were observed by immunoblotting (red arrowheads). GABRG2 mainly localize cell membrane and were hardly affected by NPR-ECD expression. Scale bars, 10 μm. Data are mean ± SEM. Numbers in bars indicate number of HEK293 cells/experiments analyzed. *p < 0.05 (Student's t test). **p < 0.01 (Student's t test). ***p < 0.001 (Student's t test).
