Figure 5.

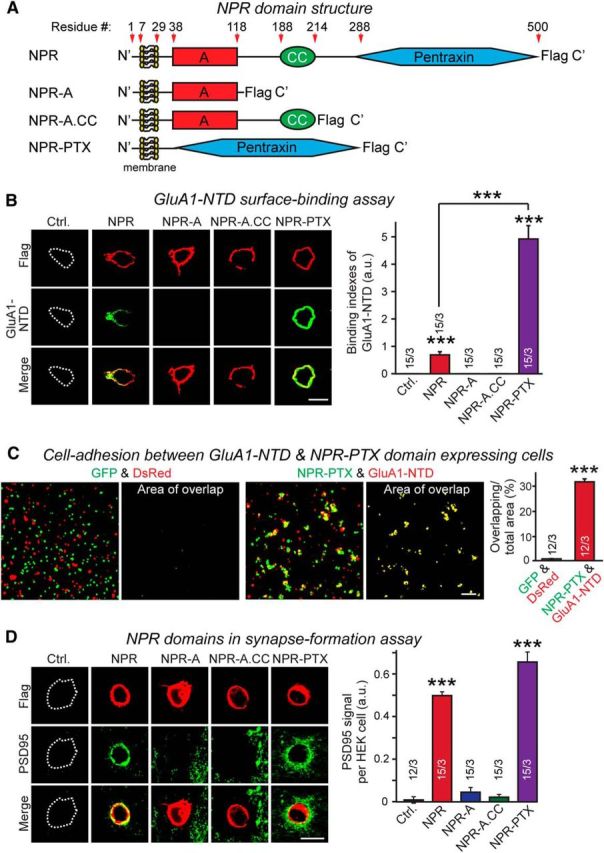
The pentraxin domain of NPR mediates binding to GluA1-NTD and trans-cellular adhesion between cells expressing NPR and GluA1, and induces postsynaptic specializations during heterologous synapse formation. A, Schematic structures of NPR and of various NPR truncation mutants. NPR comprises an N-terminal TMR, an A domain containing low-complexity sequences, a predicted coiled-coil domain (CC), and a C-terminal pentraxin domain that accounts for nearly half of the entire protein. All NPR constructs contained a C-terminal Flag epitope. B, Recombinant GluA1-NTD (expressed as a soluble Fc-domain fusion protein) efficiently binds to HEK293 cells expressing full-length NPR or the pentraxin domain of NPR, but not to NPR proteins lacking the pentraxin domain. Left, Representative images. Right, Summary graph. The apparently stronger binding of GluA1-NTD to the NPR pentraxin domain as opposed to full-length NPR is likely due to increased expression levels between the two constructs. C, Cells expressing the membrane-tethered NPR pentraxin domain (NPR-PTX) readily form cell adhesion complexes with cells expressing the membrane-anchored GluA1-NTD. Separate sets of HEK293 cells were transfected with EGFP or DsRed (control), or cotransfected with EGFP and NPR-PTX or DsRed and GluA1-NTD, cells were mixed, and cell adhesion was measured by imaging the overlap between EGFP and DsRed signals at low magnifications. Left, Representative images. Right, Summary graph. D, NPR pentraxin domain is sufficient to induce excitatory postsynaptic specialization during heterologous synapse formation. Hippocampal mouse neurons were cocultured with control HEK293 cells (Ctrl.), or HEK293 cells expressing Flag-tagged NPR proteins shown in A. Postsynaptic specializations formed on the HEK293 cells were analyzed by immunocytochemistry for the Flag epitope (red, to visualize the NPR proteins) and PSD95 (green, to visualize postsynaptic specializations). Left, Representative images. Right, Summary graphs of the PSD95 staining intensity. Scale bars: B, D, 10 μm; C, 100 μm. Graphs represent mean ± SEM. Numbers in bars indicate number of HEK293 cells/experiments analyzed. ***p < 0.001 (one-way ANOVA test with Tukey's post hoc test).
