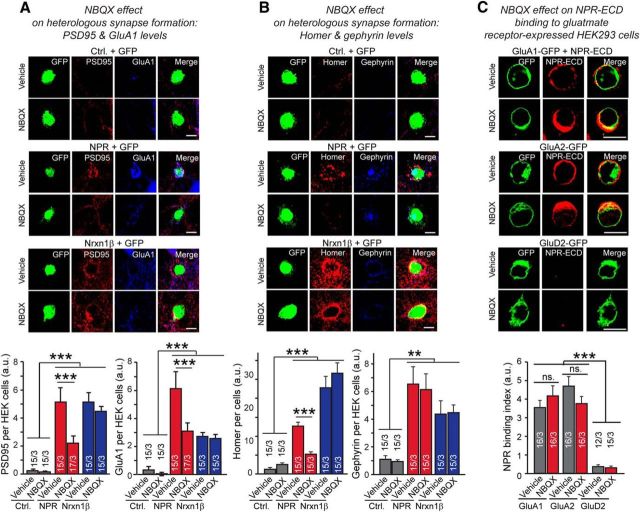
Figure 7.
AMPAR antagonist NBQX selectively inhibits NPR-mediated induction of excitatory and postsynaptic specializations during heterologous synapse formation but has no effect on neurexin-1β-induced heterologous synapse formation. A, NBQX impairs heterologous synapse formation induced by NPR, but not by neurexin-1β. Control HEK293 cells or HEK293 cells transfected with expression plasmids encoding Flag-tagged NPR or neurexin-1β (Nrxn1β, SS4+ variant) were cocultured with hippocampal neurons at DIV16. In the absence or presence of 20 μm NBQX added right before seeding the HEK cells onto neurons, heterologous synapses were analyzed by immunolabeling for GluA1 levels (blue) and for the postsynaptic density protein PSD95 (red) at DIV17, after 24 h of coculture. Left, Representative images. Right, Summary graphs of the PSD95 and GluA1 staining intensity. B, NBQX impairs excitatory, but not inhibitory, heterologous synapse formation. Experiments were performed as described for A with inclusion of neurexin-1β as a positive control, but heterologous synapses on a HEK293 cell were simultaneously analyzed for the excitatory postsynaptic marker Homer and the inhibitory postsynaptic marker gephyrin. HEK293 cells contain a mixture for both excitatory and inhibitory postsynaptic specializations. C, NBQX does not change binding levels of NPR-ECD to GluA1 and GluA2 expressed in HEK293 cells. HEK293 cells transfected with GluA1-GFP, GluA2-GFP, or GluD2-GFP (all together with stargazin to facilitate GluA receptor function) (Chen et al., 2000) were incubated for 2 h at room temperature with recombinant NPR extracellular domains (NPR-ECD, composed of the extracellular sequences NPR with a C-terminal Flag- and His-tag) in the presence or the absence of 20 μm NBQX. Cells were immunostained with anti-Flag antibody. NPR-ECD (red) binds to both HEK293 cells transfected GluA1-GFP or GluA2-GFP but not GluD2-GFP. Bar graphs represent intensities of staining signals for NPR-ECD on the surface of HEK293 cells expressing GluA1-GFP, GluA2-GFP, or GluD2-GFP as labeled. Scale bars, 10 μm. Graphs represent mean ± SEM. Numbers in bars indicate number of HEK293 cells/experiments analyzed. **p < 0.01 (one-way ANOVA test with Tukey's post hoc test). ***p < 0.001 (one-way ANOVA test with Tukey's post hoc test).

