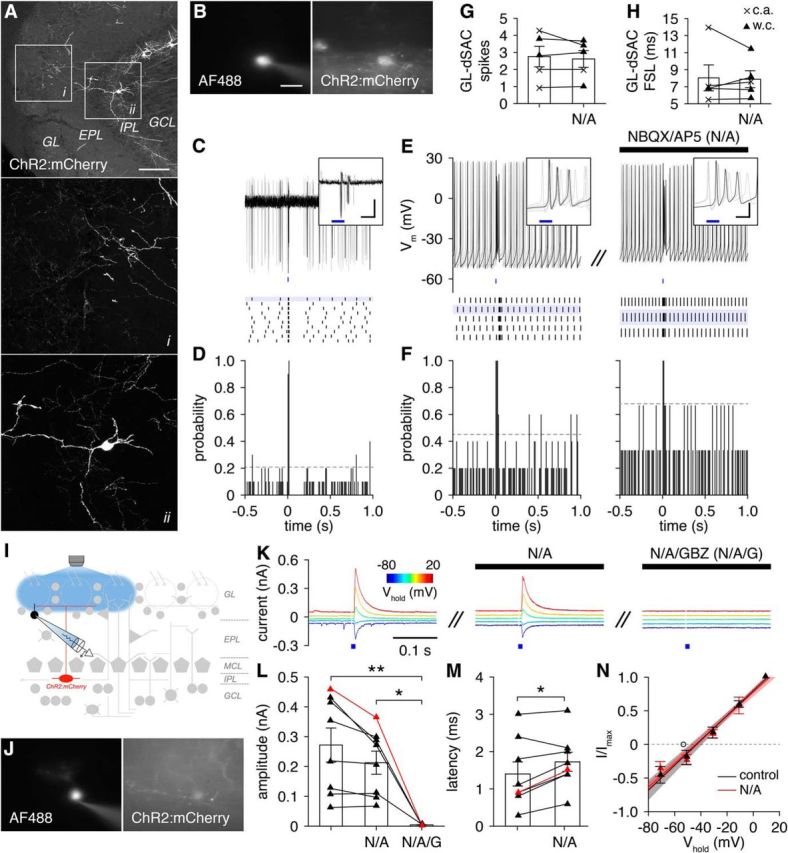
Figure 11.

GL-dSACs innervate PGCs. A, Cre-dependent ChR2:mCherry expression. Scale bar, 100 μm. B–D, Representative cell-attached recording (and post hoc cell fill; scale bar, 20 μm) of a GL-dSAC after brief photostimulation (10 ms; blue line). Results plotted as in Figure 6. Inset scale bar, 10 ms/50 pA. E, F, Same as C and D for whole-cell recording from a different GL-dSAC before and after NBQX/AP5 application. Inset scale bar, 10 ms/20 mV. G, H, Photostimulation evoked 1–4 action potentials in GL-dSACs independent of glutamatergic transmission (spikes: 2.8 ± 1.3 vs 2.6 ± 1.1, before vs after NBQX/AP5 application; n = 5; p = 0.48, two-tailed paired t test; first-spike latency, FSL,: 8.0 ± 3.4 vs 7.9 ± 2.2 ms, before vs after NBQX/AP5 application; n = 5; p = 1.0, two-sided Wilcoxon signed-rank test). w.c., Whole-cell recordings; c.a., cell-attached recordings. I, Synaptic input to PGCs was recorded after GL-dSAC photostimulation. J, K, Representative whole-cell recording of photostimulation-evoked input to a PGC across various holding potentials (corrected for liquid junction potential). NBQX/AP5 application blocked sEPSCs but had no effect on evoked input, whereas GBZ application abolished the evoked input. L, M, Amplitude (L) and latency (M) of GL-dSAC-mediated input to PGCs. Application of GBZ but not NBQX/AP5 blocked the evoked input to PGCs (L; 0.27 ± 0.16, n = 8, vs 0.21 ± 0.11, n = 8, vs 0.00 ± 0.00 nA, n = 4, control vs NBQX/AP5 application vs NBQX/AP5/GBZ application; p = 9.4 × 10⁻³, one-way ANOVA; control vs NBQX/AP5/GBZ application, p = 7.5 × 10⁻³, NBQX/AP5 application vs NBQX/AP5/GBZ application, p = 0.037, post hoc Tukey–Kramer). NBQX/AP5 application minimally increased the latency of evoked input (M; 1.4 ± 0.9, n = 8, vs 1.7 ± 0.7 ms, n = 8, before vs after NBQX/AP5 application; p = 0.024, two-tailed paired t test). Red points denote cell shown in J and K. N, Current–voltage relationship (corrected for liquid junction potential) of the evoked input to PGCs (n = 5) was independent of glutamatergic transmission (−44.6 ± 7.8 vs−44.0 ± 5.0 mV without or with NBQX/AP5 application; p = 0.69, two-sided Wilcoxon rank-sum test). The reversal potential of evoked input to PGCs (n = 5) was significantly more depolarized than the reversal potential of evoked input to ETCs (n = 4) and ETC-like sTCs (n = 4) (open circle) (−44.6 ± 7.8 vs −53.3 ± 6.9 mV; p = 0.029, one-tailed unpaired t test).
