Figure 14.
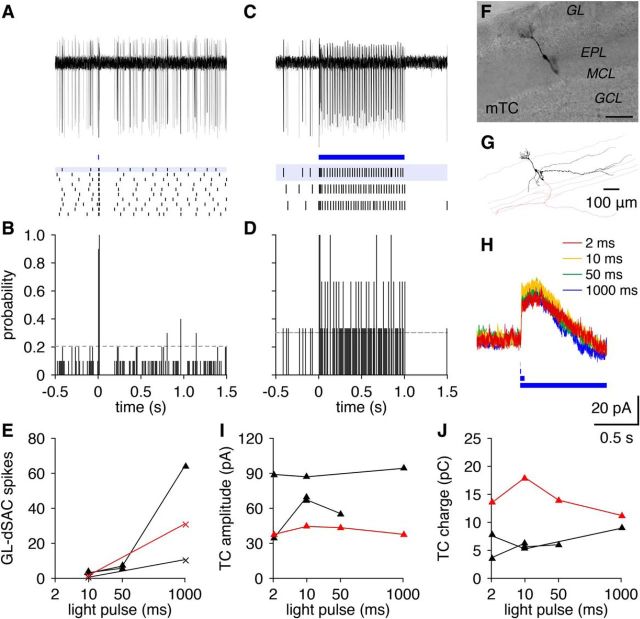
GL-dSAC-mediated long-lasting TC inhibition is all-or-none. A, B, Brief photostimulation (10 ms; blue line) evoked one or two action potentials in cell-attached recordings from GL-dSACs expressing ChR2:mCherry. Same cell as in Figure 11B. Results are plotted as in Figure 6. C, D, Same as A and B for prolonged photostimulation (1 s). E, Increasing photostimulation duration increased the number of evoked spikes in GL-dSACs expressing ChR2:mCherry. Red points denote cell shown in A–D. F, G, Neurobiotin fill (F) and reconstructed morphology (G) of a representative TC. Scale bar, 100 μm. H, Whole-cell voltage-clamp recording of the mean postsynaptic currents (Vhold = +10 mV) in the cell shown in F and G evoked by varying-duration photostimulation of GL-dSACs expressing ChR2:mCherry. I, J, Amplitude (I) and charge (J) of inhibitory synaptic input to TCs evoked by varying duration photostimulation of GL-dSACs. In contrast to the increasing number of spikes evoked in GL-dSACs with increasing photostimulation duration (E), inhibitory synaptic input to TCs occurred in an all-or-none manner. Red points denote cell shown in F–H.

