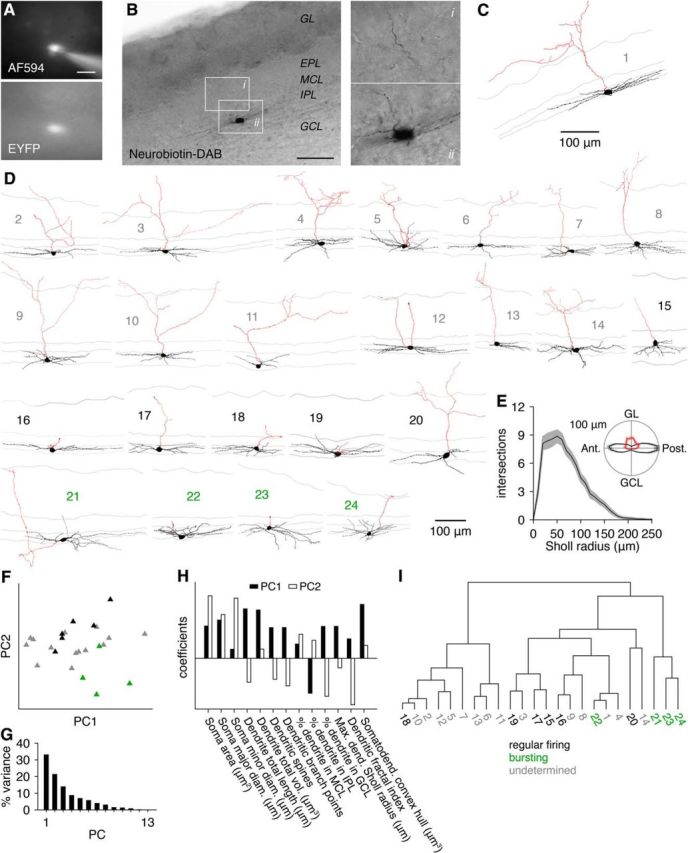
Figure 3.

Morphological properties of GL-dSACs. A, B, EYFP-expressing dSACs in Chrna2-Cre/Ai3 mice were filled with AF594 and Neurobiotin via whole-cell recordings. Insets show axon projecting through the EPL and into the GL. Scale bar, 20 μm (A); 100 μm (B). C, Reconstructed morphology of the cell shown in A and B. Scale is the same as in B. D, Additional reconstructions, sorted by firing pattern. Gray numbers mark GL-dSACs in which the firing pattern was undetermined; black numbers mark regularly firing GL-dSACs; green numbers mark bursting GL-dSACs. E, Dendritic Sholl analysis. Inset, Mean angular distribution of reconstructed dendritic and axonal process lengths showing horizontal dendritic extensions (black) and superficial axonal projections (red) (n = 24). F, Projection of regular firing (black) and bursting (green) GL-dSACs and GL-dSACs with undetermined firing patterns (gray) onto the first two principal components (PC1 and PC2) identified from principal component analysis of GL-dSAC morphological properties. No obvious clustering of GL-dSACs by firing pattern emerged. G, Variance in GL-dSAC morphological properties explained by each principal component. H, Decomposition of PC1 and PC2 into their constituent property coefficients. I, Unbiased agglomerative hierarchical clustering of GL-dSACs by the Euclidean distances among the z-scored morphological properties listed in H (using Ward's method). Application of the gap statistic method yielded one cluster.
