Figure 6.

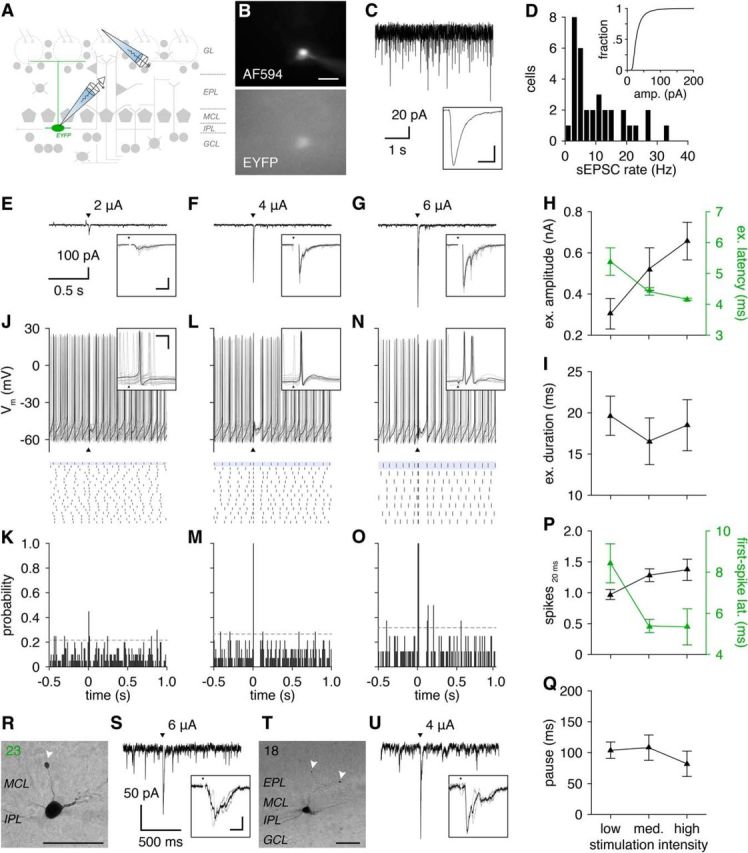
OSN stimulation resets the spontaneous firing phase of GL-dSACs. A, Excitatory input to GL-dSACs was recorded after activation of a single glomerulus by OSN stimulation. B, Whole-cell recording of a representative EYFP-expressing GL-dSAC. Scale bar, 20 μm. C, Example recording of sEPSCs from the cell shown in B. Inset, Mean sEPSC (scale bar, 4 ms/10 pA). D, Distribution of GL-dSAC sEPSC rates (10.4 ± 8.2 Hz, n = 33). Inset, Distribution of sEPSC amplitudes. E, Low-intensity OSN stimulation (arrowhead) evoked a short burst of EPSCs in the cell shown in B. Mean response shown. Inset, Magnification of synaptic response (scale bar, 10 ms/200 pA). Individual trials are shown in a lighter color. F, G, Same as E for medium-intensity (F) and high-intensity (G) OSN stimulation. H, I, Mean amplitude (H), latency (H), and duration (I) of feedforward excitatory input to GL-dSACs after low-intensity (2.5 ± 1.4 μA; n = 12), medium-intensity (4.3 ± 2.3 μA; n = 6), and high-intensity (5.3 ± 1.2 μA; n = 3) OSN stimulation. J, Low-intensity OSN stimulation (arrowhead) evoked a single action potential and partially reset the spontaneous firing phase of the cell shown in B. Multiple trials are shown (top), with a single trial plotted in black for clarity and a raster plot of spike times across trials (bottom; highlighted trial corresponds to trial plotted in black). Inset: magnification of spiking response (scale bar, 10 ms/20 mV). K, PSTH (10 ms bins) shows a rapid peak in action potential probability after OSN stimulation at 0 s (dashed line: 95% confidence interval of basal action potential probability). L–O, Same as J and K for medium-intensity (L, M) and high-intensity (N, O) OSN stimulation. P, Mean number of action potentials evoked within 20 ms after low-, medium-, and high-intensity OSN stimulation. Mean first-spike latency is plotted on the secondary axis. Q, Mean pause in spontaneous firing following feedforward sensory-evoked firing. R–U, Two representative GL-dSACs with truncated axons (arrowheads) exhibiting excitatory input after OSN stimulation. Cell numbers and color code are reproduced from Figure 3. Morphology scale bars, 50 μm. Inset scale bar, 10 ms/50 pA.
