Figure 8.
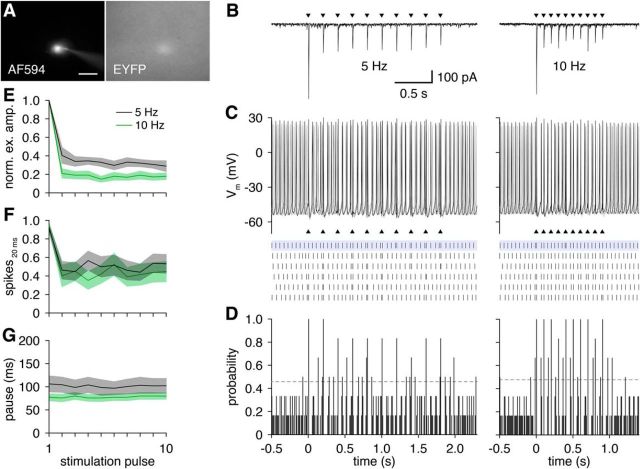
GL-dSAC firing tracks theta-frequency OSN stimulation reliably. A, Whole-cell recording of a representative EYFP-expressing GL-dSAC. Scale bar, 20 μm. B, Train of OSN stimuli (black triangles) at 5 or 10 Hz evoked a time-locked train of depressing excitatory input to the cell shown in A. C, D, Train of OSN stimuli (black triangles) at 5 or 10 Hz evoked single time-locked action potentials in the cell shown in A. Results are plotted as in Figure 6. E, Mean amplitude of feedforward excitatory input to GL-dSACs across 10 OSN stimulation pulses at 5 (n = 10) or 10 Hz (n = 7) normalized to the first stimulation pulse response. Excitatory input to GL-dSACs exhibits substantial initial frequency-dependent depression, followed by stable responses. F, Mean number of action potentials evoked within 20 ms after each of 10 OSN stimulation pulses at 5 (n = 11) or 10 Hz (n = 11). G, Mean pause in spontaneous firing after OSN stimulation-evoked firing in each of 10 OSN stimulation pulses at 5 (n = 11) or 10 Hz (n = 11).

