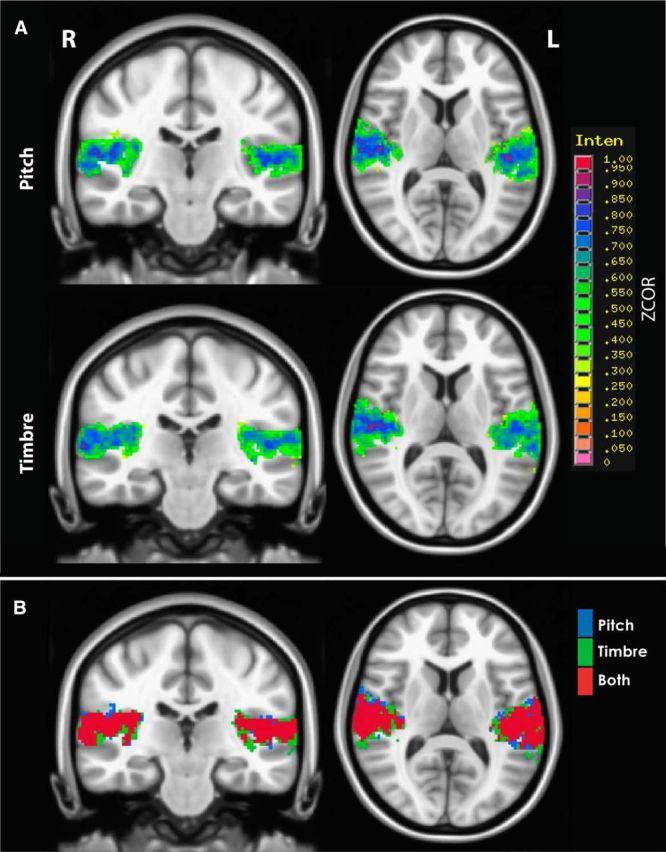
Figure 4.

A, B, Group-level correlation coefficient maps. A, Heat maps of positive mean Fisher's z-transformed correlation coefficients (ZCOR) for pitch (top) and timbre (bottom), limited to voxels within a union of all subjects' iROI masks. No significant negative correlations were found. A cluster is shown in each hemisphere for pitch [peak: right (R), 52, −10, 6; left (L), −46, −24, 10] and timbre (peak: R, 48, −20, 12; L, −52, −18, 6) conditions, respectively. B, Maps indicating which voxels the maps in A have in common. The significant correlation coefficients within the pitch map (blue), the significant correlation coefficients within the timbre map (green), and the voxels these two maps have in common (red).
