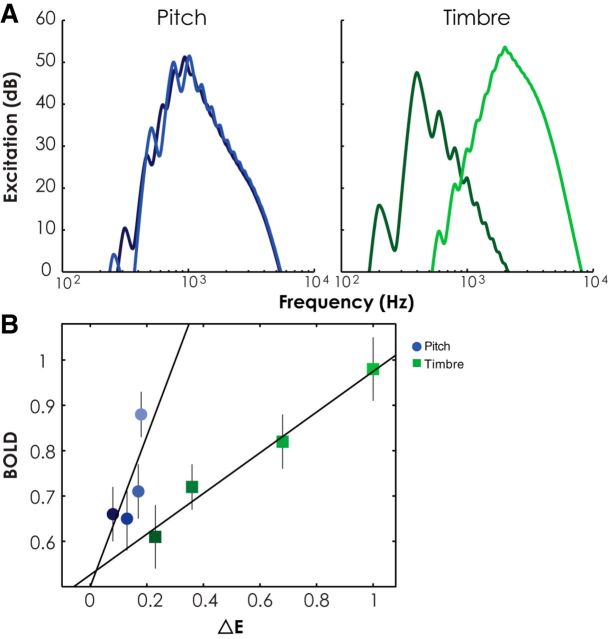
Figure 7.
A, Excitation patterns for the highest and lowest steps of the largest step size (10× DL) for the pitch and timbre conditions, respectively. Lighter colors indicate the higher pitch and brighter timbre, respectively. B, Scatter plot showing mean β weight across all 10 subjects at each step size, averaged across hemispheres as a function of ΔE with a linear regression line for each dimension. Lighter colors indicate larger step sizes. Error bars indicate ±1 SEM across subjects.

