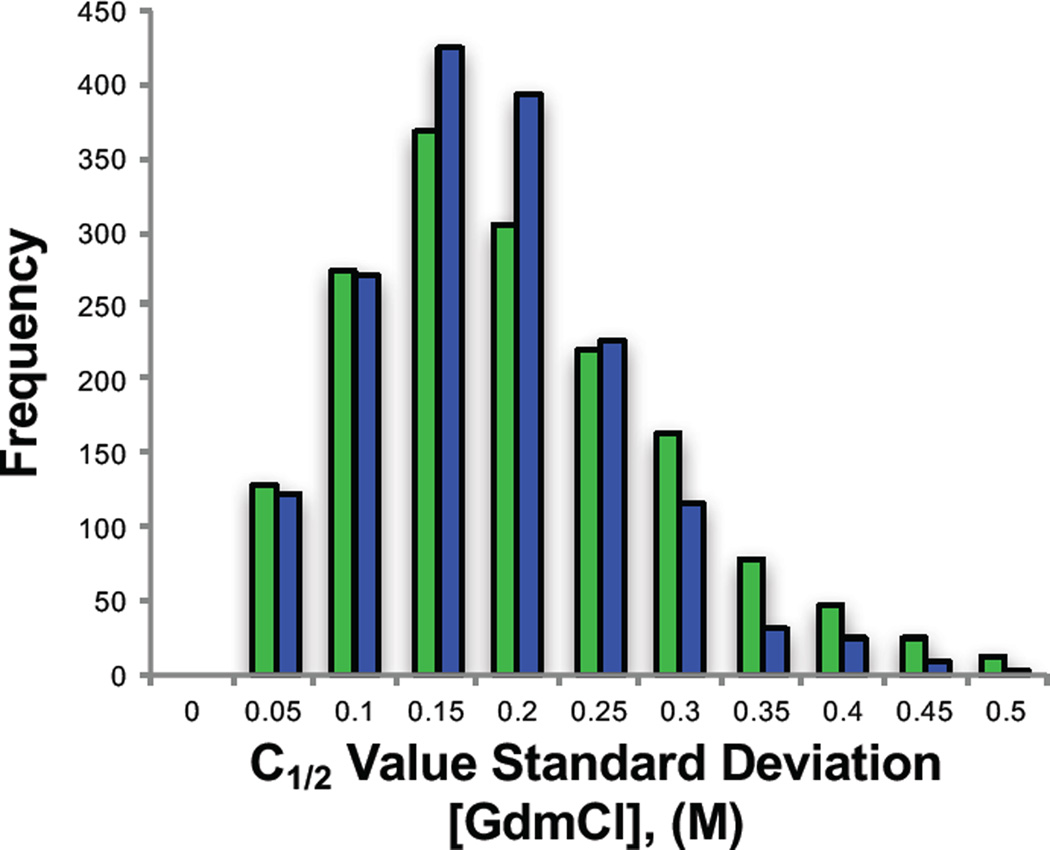
Figure 2.
Frequency distribution of standard deviations associated with the C1/2 values determined for the assayed peptides in the different young (green) and old (blue) mice. Each bar represents the number of total peptides within each standard deviation bin. The high limit of each bin is listed on the x-axis.

