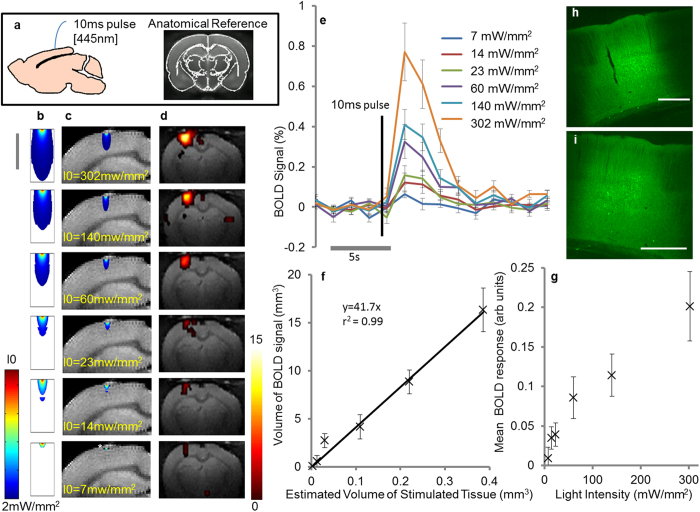
Figure 1. fMRI BOLD Response triggered by Optogenetic Activation of Cortical Neurons Using a Single 10 ms Pulse of Light.
(a) A single pulse of light (10 ms, 445 nm) was delivered to the rat somatosensory cortex (3 mm caudal to Bregma – anatomical reference is shown) at variable light intensities. (b) The volume of stimulated cortical tissue was estimated and the predicted area exceeding threshold intensity for action potential generation is shown within a 2D slice for each of the applied light intensities (I0 = 302, 140. 60, 23, 14, 7 mW mm−2 for each row respectively). The scale bar represents 1 mm. (c) Schematic illustration of the predicated area of action potential generation in the cortex at variable light intensities (to scale). The predicted volume of stimulated cortical tissue increases with the applied photo energy. * highlights the small indentation in the outer layers of the cortex from the tip of the implanted optic fibre (diameter 200 µm). (d) BOLD activation maps induced by a 10 ms pulse of light overlaid on an anatomical reference image at variable light intensities (p = 0.05, uncorrected). The spatial extent of the BOLD response increases with the volume of activated cortical tissue. Data from a single representative experiment are shown. The colour bar represents t scores from 0 to 15. (e) The mean BOLD response (+/−1 SEM) across all subjects at different light intensities. For each subject, the BOLD signal is taken from the same voxels. (f) The measured volume of BOLD response (taken from the number of “activated voxels”) plotted against the predicted volume of activated neurons receiving light which exceeds the stimulation threshold (2 mW mm−2). The mean across the subjects is shown (+/−1 SEM). A linear fit of direct proportionality was applied to the data. (g) The mean magnitude of BOLD response (see panel D) 8 seconds following light delivery plotted against light intensity. The mean across all subjects is shown (+/−1 SEM). (h/i) Representative images of coronal sections of the rat brain illustrating the extent of cortical ChR2 expression in cortical neurons following microinjections of AAV2-CamKIIa- hChR2(H134R)-eYFP. Scale bar = 500 μm.

