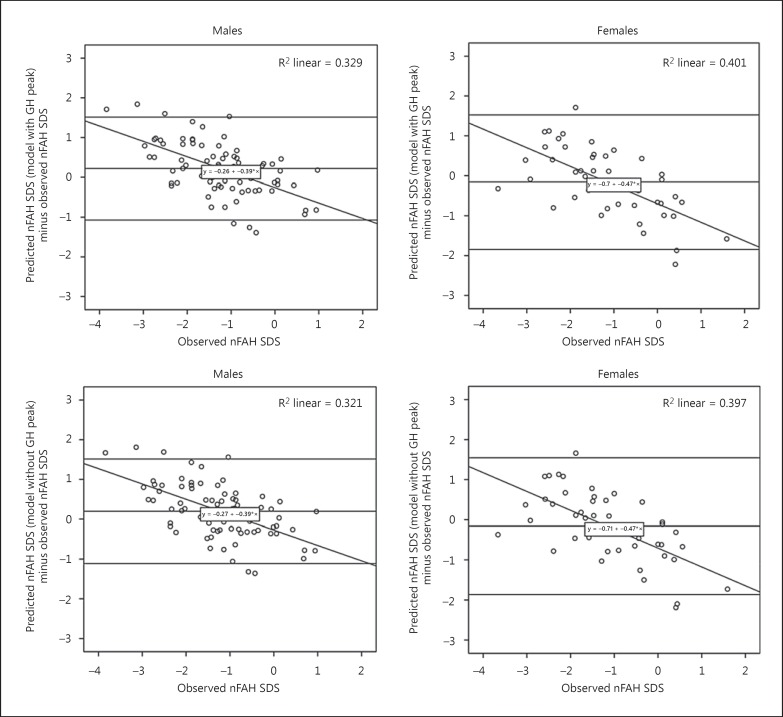
Fig. 1.
Bland-Altman plots. The horizontal lines show the mean differences and the 95% confidence intervals. Upper panels: prediction models including the GH peak; lower panels: prediction models without GH peak. All SDS calculations are based on Prader et al. [12].

