
Figure 2. High resolution accessibility mapping of the promoter structure at tRNA-Leu.
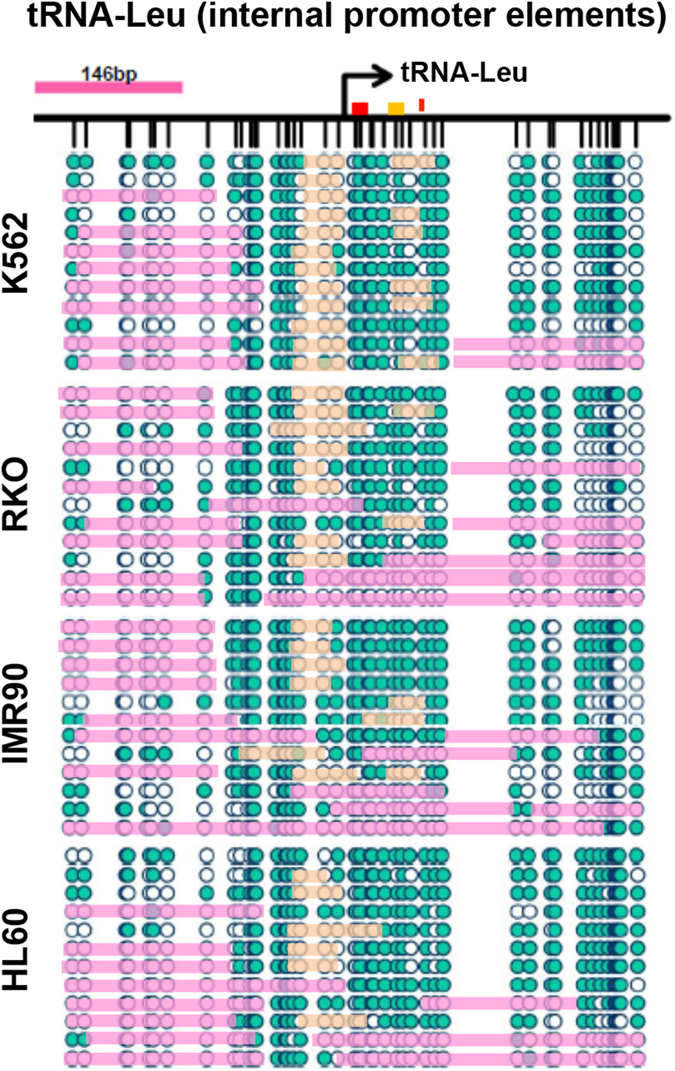
Loci-specific analysis was performed at tRNA-Leu (chromosome 14) (Type II internal promoter). To increase resolution, a modified NOMe-seq treatment that employs a combination of M.CviPI and M.SssI was performed on nuclei from four cell lines (K562, RKO, IMR90 and HL60). The resulting combinatory pattern of methylation states generates a map of chromatin accessibility and nucleosome positioning as well as occupancy at individual DNA molecules. Teal circles represent accessible GpC/CpC sites, white inaccessible. If regions of consecutive inaccessible sites equal or exceed 146 bp, we indicate the region as being occupied by a nucleosome (pink bars). Orange bars indicate regions of inaccessibility shorter than 146 bp, i.e. footprints at the TSS. Promoter elements, A and B boxes, are indicated by red and orange boxes, the red line indicates the TTS.