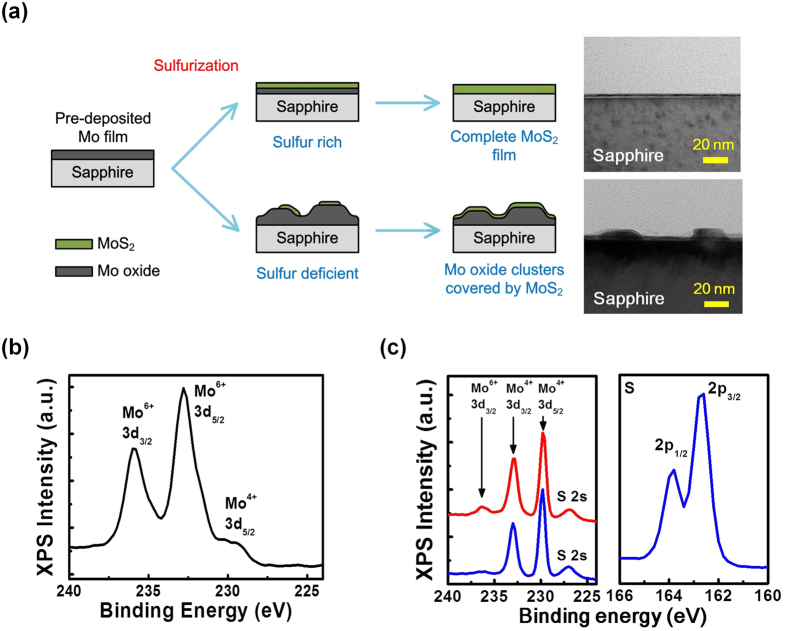
Figure 3.
(a) The schematic diagrams showing the growth evolution of the samples prepared under sulfur sufficient and deficient conditions. (b) The XPS curve measured before the sulfurization procedure. (c) The XPS curves measured after the sulfurization procedure for the two samples grown under sulfur sufficient (1.5 g sulfur, blue curve) and deficient (no sulfur supply, red curve) conditions, respectively.

