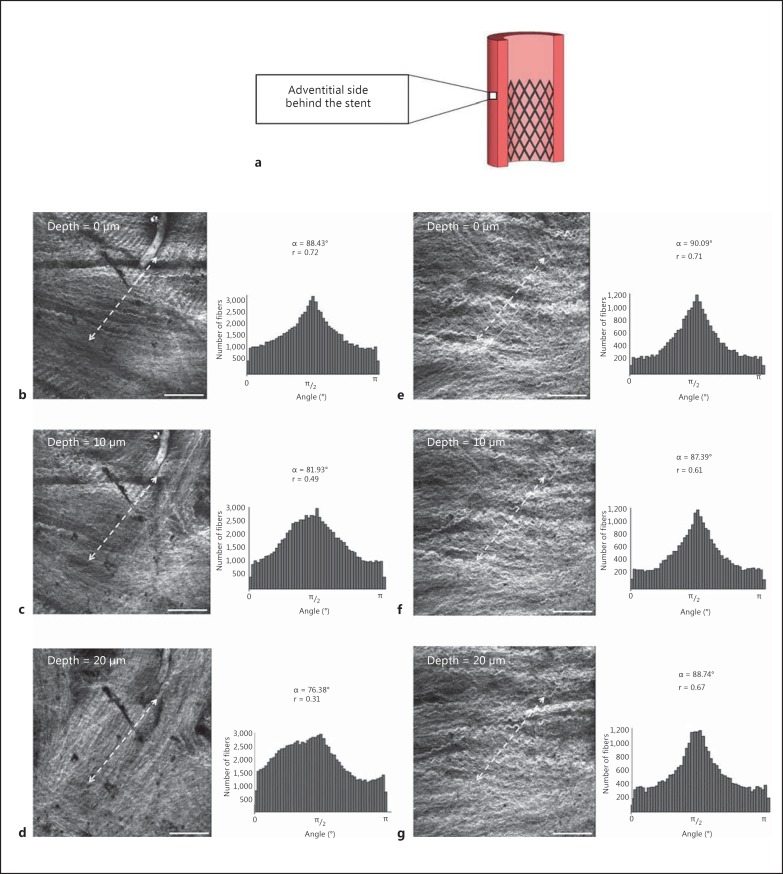
Fig. 3.
Schematic representative of the region located behind the stent and adventitial side of the artery (a), SHG images and collagen orientation quantification histograms of 2 different arteries through the arterial thickness at an imaging depth of 0 (b, e), 10 (c, f) and 20 µm (d, g). Dashed arrows represent where the stent was located. Scale bars = 200 µm.

