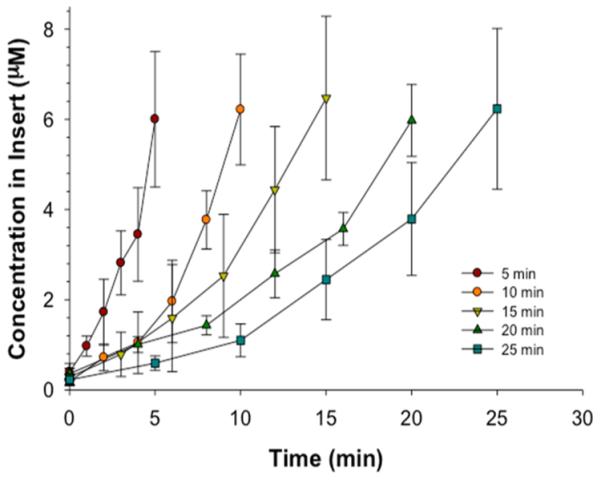
Figure 4.

Control of loading profile demonstrated with empirically determined relationships. Based upon loading times of 5, 10, 15, 20, 25 min and a theoretical desired concentration of 6.5 μM, various initial concentrations of fluorescein were obtained. At each loading time, the observed concentration was statistically equivalent to 6.5 μM (p > 0.05); n ≥ 4; error bars indicate standard deviation.
