
Figure 5.
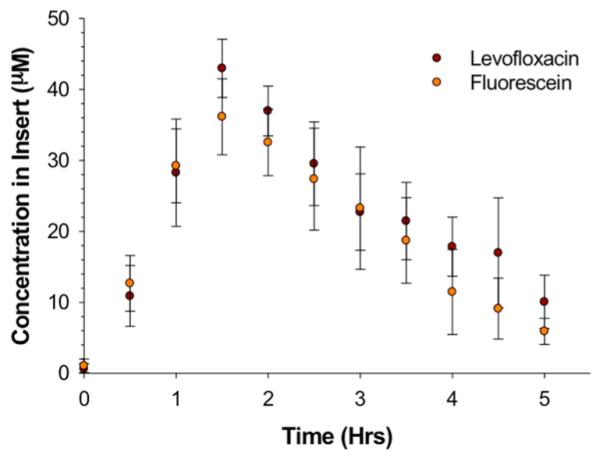
Proof of concept for the prediction model for concentration along the loading portion of the PK curve. The proof of concept of the prediction model is tested by choosing a drug that has a molecular mass comparable to that of fluorescein, here levofloxacin. The desired concentration was 25.6 μM with a loading time of 1 h. The concentration in the syringes, derived from the prediction model for 1 h of flow, was 167.3 μM. Experimentally, fluorescein and levofloxacin were statistically the same, and at 1 h the concentration was within error of the theoretical concentration. Importantly, the experimental Cmax is 43.0 ± 4.1 μM. n ≥ 4; p > 0.05; error bars indicate standard deviation.