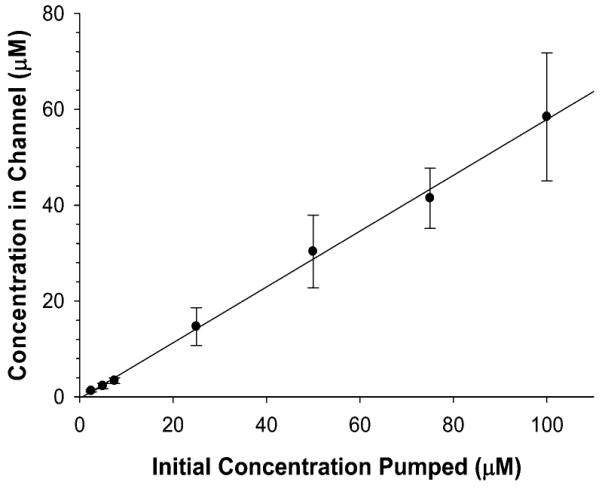
Figure 6.

Impact of absorption of fluorescein into the material of the device, analyzed by flowing various concentrations (2.5–100 μM) through the 3D printed device and sampling from open well, which generally contains the insert. The linear effect observed in the graph enables a mathematical model to be applied to correct for the absorption of fluorescein. n ≥ 4; error bars indicate standard deviation.
