Fig. 1.

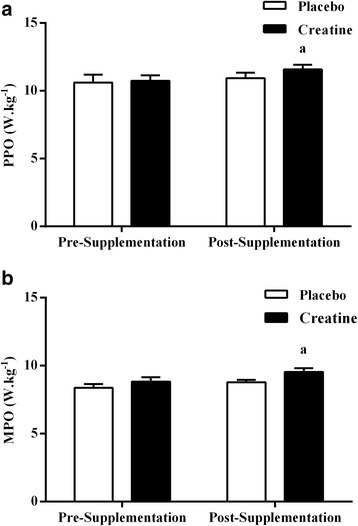
Peak power output (PPO, W.kg−1; a) and mean power output (MPO, W.kg−1; b) before and after the Cr or placebo supplementation period. a Denotes a significant difference between pre- and post-supplementation (P < 0.05). Values are mean ± SE

Peak power output (PPO, W.kg−1; a) and mean power output (MPO, W.kg−1; b) before and after the Cr or placebo supplementation period. a Denotes a significant difference between pre- and post-supplementation (P < 0.05). Values are mean ± SE