
Fig. 3.
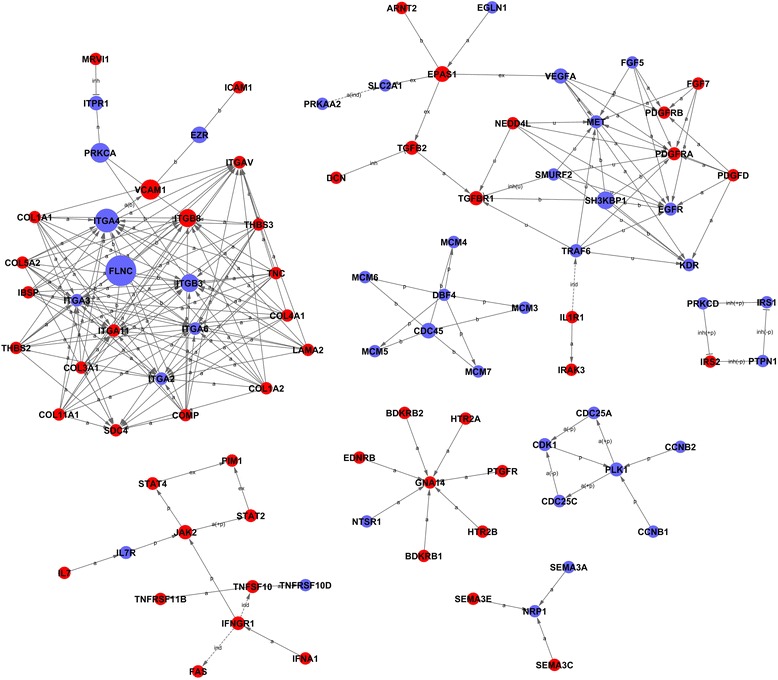
The interaction network of differentially expressed genes (Signal-net). In the Signal-net, the genes are characterized by measuring their “betweenness centrality”, the number of times a node is located in the shortest path between two other nodes. This measure reflects the importance of a node in a network relative to another. The circles represent important functional genes (red: upregulated genes; blue: downregulated genes); the circle size represents the degree of interaction (betweenness centrality), and lines indicate the interactions