
Fig. 1.
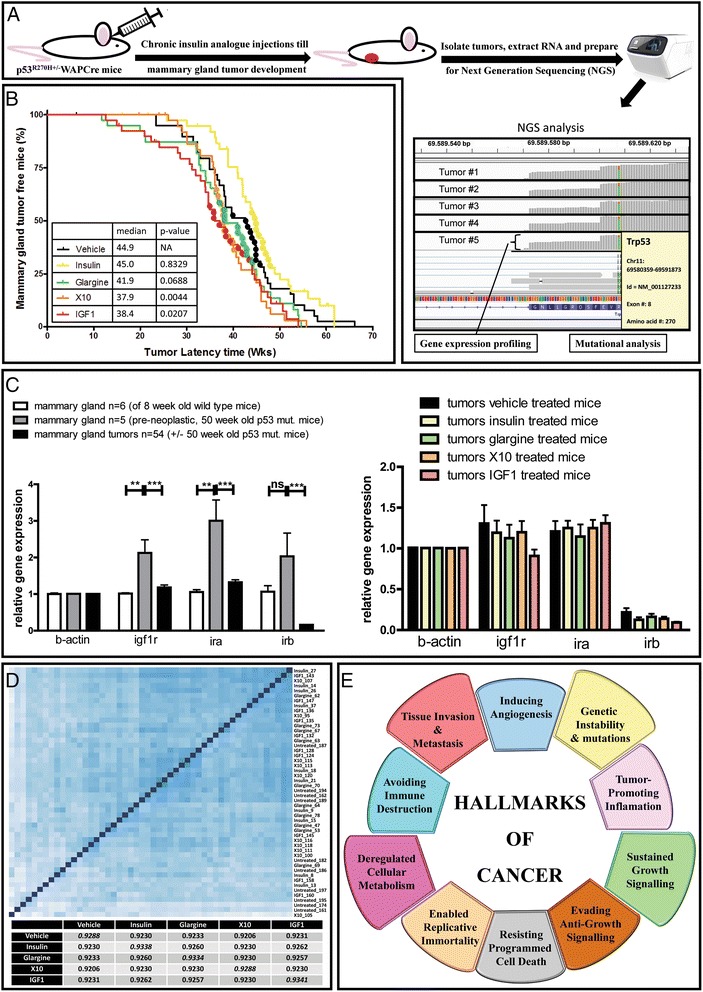
Experimental overview. a Overview of the chronic insulin analogue exposure experiment. b The Kaplan-Mayer MG tumor-free mice plots with the median tumor latency per treatment group; the colored dots indicate the selected tumors for the transcriptomic analysis. c the insulin-like growth factor-1 receptor (igf1r), A isoform of the insulin receptor (ira), and B isoform of the insulin receptor (irb) gene expression levels in MG tissue of young mice (8 weeks), old mice (~50 weeks), and in MG tumors (first graph); the second plot (right) shows the receptor gene expression distribution in the MG tumor tissue of mice chronically exposed to different insulin analogues. d Heat map of the next-generation sequencing data showing hierarchical sample clustering by sample-to-sample distance; the lower table shows the Spearman rank correlation coefficients within the treatment groups (bold) and the coefficient between the different treatment groups (averaged per condition). e The hallmarks of cancer with the features highlighted that we will discuss in view of the chronic insulin analogue exposure experiment. **P < 0.01, ***P < 0.001. ns not significant. (Adapted from Hanahan and Weinberg [9])