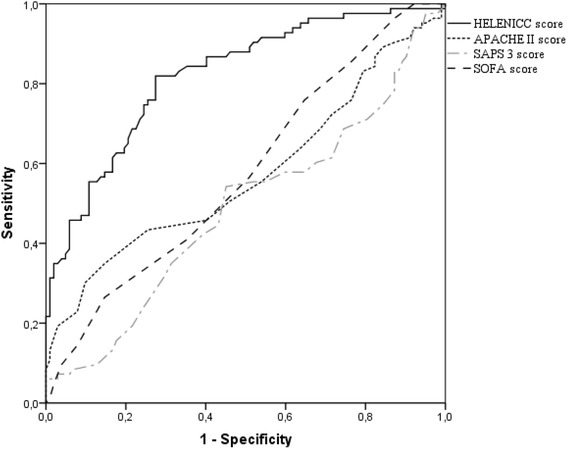
Fig. 2.

Area under the ROC curve for the HELENICC score (0.82; 95% CI = 0.76–0.88); APACHE II score (0.57; 95% CI = 0.48–0.66); SAPS 3 score (0.48; 95% CI = 0.40–0.57) and SOFA score (0.58; 95% CI = 0.49–0.66)

Area under the ROC curve for the HELENICC score (0.82; 95% CI = 0.76–0.88); APACHE II score (0.57; 95% CI = 0.48–0.66); SAPS 3 score (0.48; 95% CI = 0.40–0.57) and SOFA score (0.58; 95% CI = 0.49–0.66)