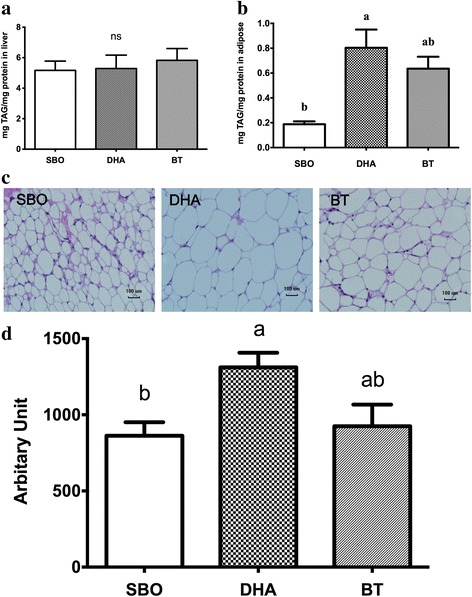
Fig. 2.

Tissues analysis. TAG in liver a and adipose tissue b Histological adipocyte areas in subcutaneous fat using H&E staining c Quantitative representation of average adipocyte area in subcutaneous fat in a 100-μm2 area d Quantification of the size of adipocytes was by Image J analysis. All conditions were as in Fig. 1. Adipocyte area was determined from 10 pigs/group. ns represent no significant difference between each group
