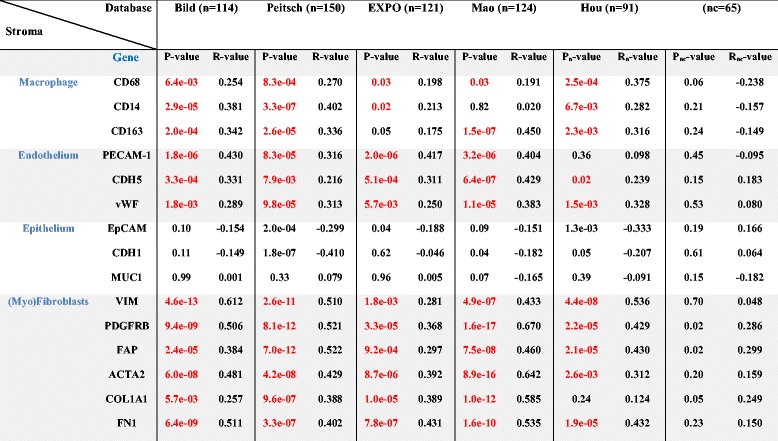
Table 2.
Correlation of gene expression between PAR-1 and markers of different stromal cell types

Selection of the datasets is based on the patient group size ≥50. Bild (n = 114, GSE3141), Peitsch (n = 150, GSE43580), EXPO (n = 121, GSE2109), Mao (n = 124, GSE 31852), Hou (n = 91, control group nc = 65, GSE 19188). Linear regression analysis was used to determine p-value of correlation. Significant correlations are indicated in red
