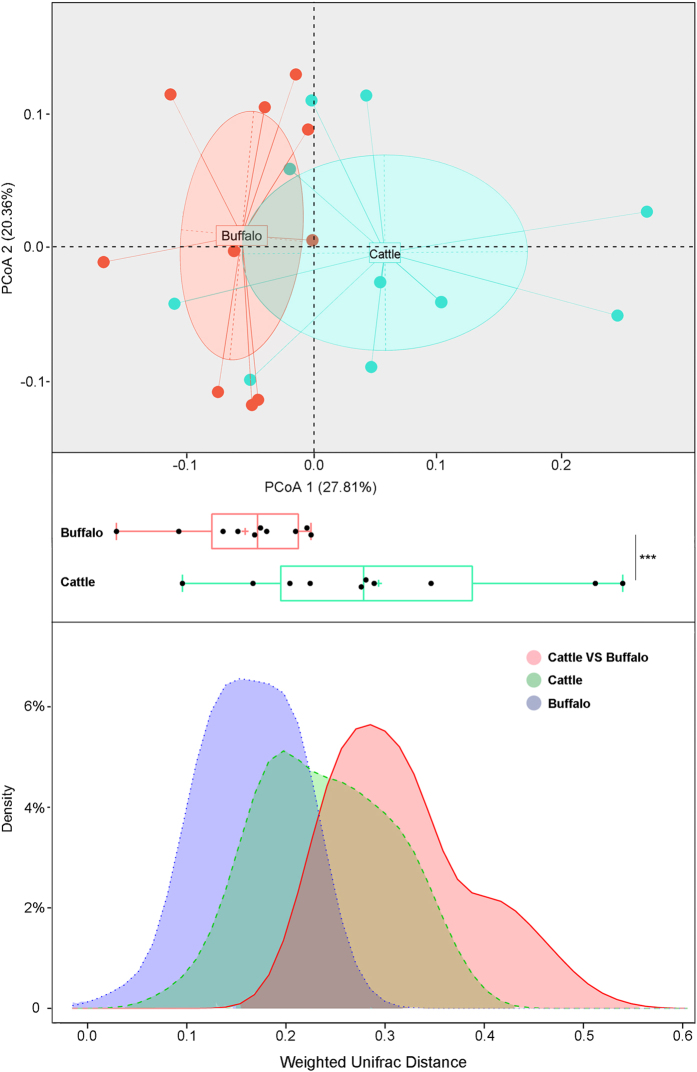
Figure 2. Differences in gut microbiota between buffalo and cattle.
(A) A principal component (PCoA) score plot based on weighted UniFrac metrics for all samples. Each point represents the composition of the intestinal microbiota of one sample. (B) The kernel density profile based on weighted UniFrac distance within and between buffalo and cattle.

